Cardano (ADA/USDT) Struggles for Momentum: What to Expect
Estimated Reading Time: 3 minutes
Don’t invest unless you’re prepared to lose all the money you invest. This is a high-risk investment and you are unlikely to be protected if something goes wrong. Take 2 minutes to learn more

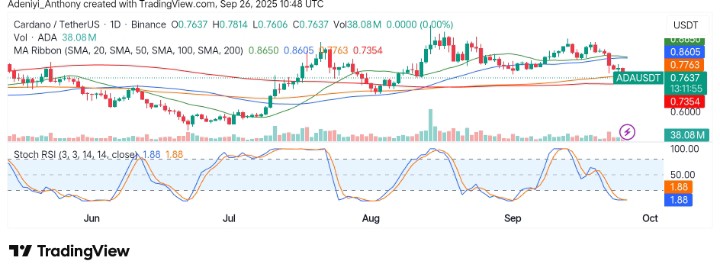
The Cardano against Tether chart reveals a period of consolidation in the market after a rally. Currently, with price action showing signs of indecision, the pair is currently hovering around key moving averages, which suggests a market without direction.
Recently, the price action shows a downward retracement as the price struggles to hold above the support at 0.7354. This indicates a potential bearish bias if key levels break down. However, at the moment, the momentum indicator signals an oversold condition for the pair, but the requirement for a bullish outlook will be determined at $0.8520.
Currently, Cardano trades at $0.7637 despite recording over 38 million in traded volumes for the day.
Technical Indicators
Major Resistance Levels: $0.8605, $0.9250, and $1.0000
Major Support Levels: $0.7354, $0.6550, and $0.5100
Cardano Technical Analysis
Technically, Cardano against Tether appears to be approaching the $0.7354 support within a close range as the pair displays indecision. The price action against the moving average ribbons shows the pair is heading south. However, the Stochastic RSI suggests the oversold condition could change the market direction soon.
From the fundamental side, Cardano has seen a downtrend today because of a 3.3% drop in Bitcoin. Also, the delay in the Grayscale Cardano ETF decision can also be attributed to this deep.
ADAUSDT in the Breakout!
Although the tendency of Cardano to record another low aside from the previous session’s dip is beyond likely. However, this is only happening in the smaller timeframe. As it stands, the coin seems to be hovering between $0.8520 and $0.7450. A break above the current resistance will be the start of an upside recovery. However, as long as the current pullback is corrective, a bigger breakout may be recorded around $0.9250.
ADA/USDT Analysis: Facing Critical Testing Zone
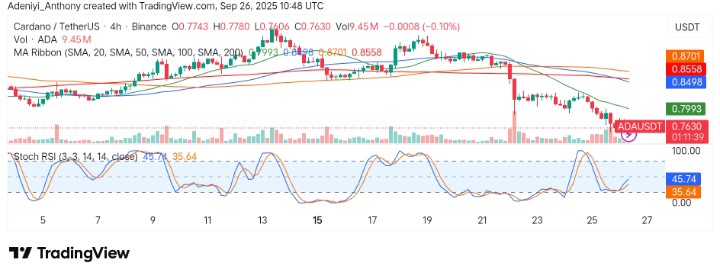
In the 4-hour chart, ADA/USDT is testing a crucial support level at $0.7630 after a sharp sell-off, indicated by the price action moving below key moving averages. At the moment, the Stochastic RSI shows a slight recovery, with the value rising from the oversold zone (35.64) to 45.74. This signals a possible bullish momentum as ADA remains below the $0.7993 resistance.
To this end, a break below $0.7630 could see further declines toward the next support at $0.5100. However, the bulls need to reclaim the $0.8250 level to regain control and aim for higher targets.
You can purchase crypto coins here. Buy Crypto