Chainlink Price Mean Reversion, Wave Structure, and Price Projection
Estimated Reading Time: 4 minutes
Don’t invest unless you’re prepared to lose all the money you invest. This is a high-risk investment and you are unlikely to be protected if something goes wrong. Take 2 minutes to learn more

The market for Chainlink over the last 24 hours has been experiencing a price dip, dropping 0.84% against Tether towards the $8.00 psychological level. As it stands, the fall in Chainlink price reflects the strength of the broader selling pressure and capital rotation from Altcoins.
Technically, the token’s near-term outlook depends on the maintenance of the current support level around $8.83. Meanwhile, if this level fails to hold, the price may slide into $6.00, as true recovery requires a change in the seasonal indicator.
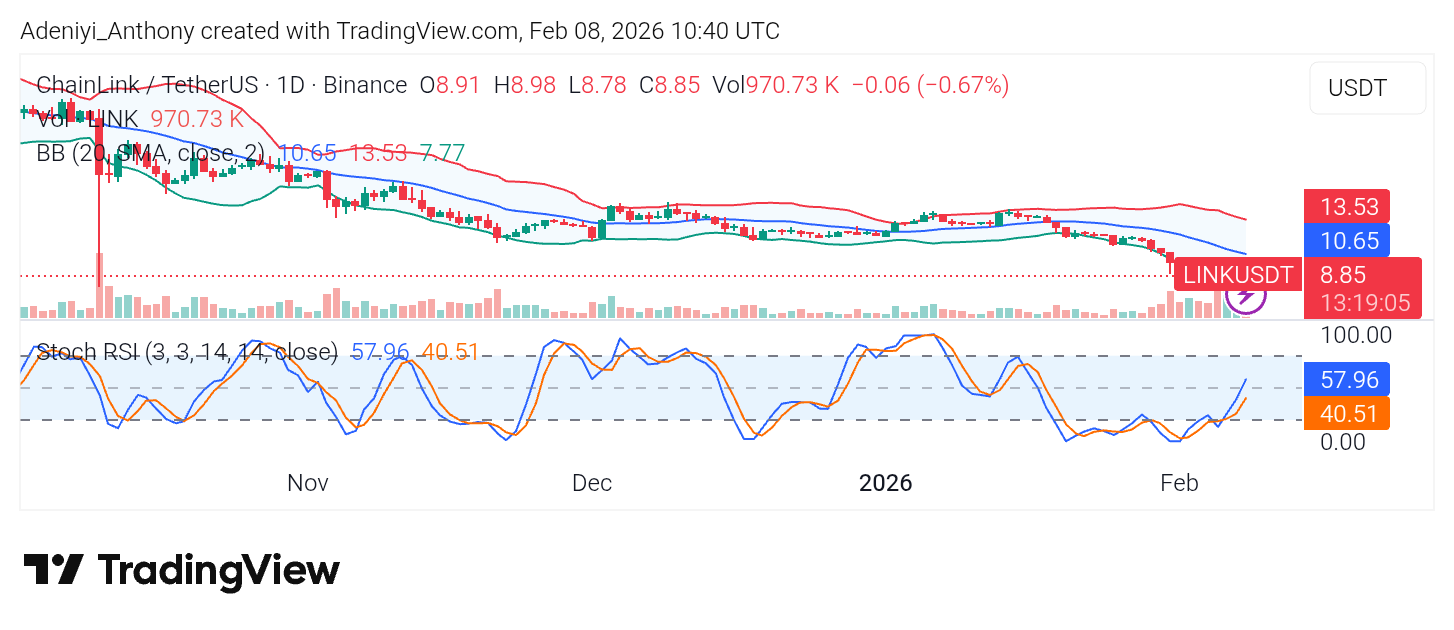
Currently, Chainlink trades at $8.85 with more than 970.73k traded volumes on the daily timeframe.
Technical Indicator
Major Resistance Levels: $9.31, $10.65, and $13.53
Major Support Levels: $8.35, $7.77, and $7.00
Chainlink Price Projection
Chainlink is holding above the lower border of the symmetrical triangle on the 2W timeframe🔍
The bulls are establishing their position at this key technical support level👀
A strong bounce could drive the price toward targets at $11, $30, and $50🎯 pic.twitter.com/uqazNom04O
— Profit Demon (@profitdemon) February 7, 2026
Profit Demon, a Chainlink trader and analyst, posted a moment ago on X (formerly Twitter) that the Chainlink price is maintaining its position above the lower boundary within the symmetrical triangle pattern formation. The analyst is of the opinion that the bullish traders are successfully defending the critical support level. Therefore, it was stated that if the token records a strong bounce, the $11 – $50 range may be the next operating range.
Technical Analysis
On the daily timeframe, Chainlink against Tether shows a prolonged descending trend with Chainlink price operating close to the lower Bollinger Bands. As it stands, the $7.77 support level is the only support preventing further fall, particularly into the $6.00 level.
Meanwhile, the Stochastic RSI curls upward from the oversold region, suggesting downward pressure is waning, and a brief bounce towards the dynamic band ($10.65) could be on the horizon. Conversely, a fall below the identified support level will pave the way for further downside risk.
Understanding Chainlink Price Wave Structure
Chainlink is technically respecting the micro support between $8.46 and $8.75 following a three-wave corrective decline. As it stands, the current price action suggests a developing five-wave impulsive move with the third wave showing aggressive strength. Though the immediate trendline above the formed triangle is being tested, anticipation should be towards a brief wave-4 pullback before setting the stage for a potential bullish springboard.
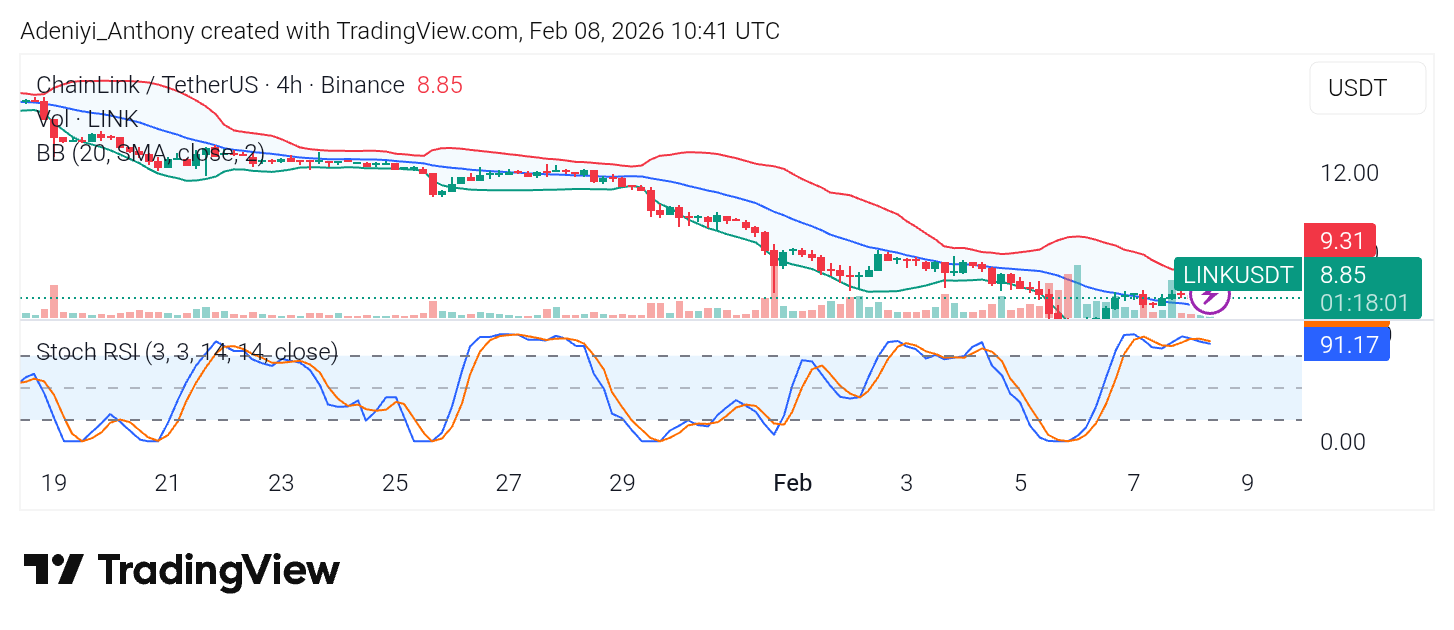
LINK/USDT Analysis: Identifying Volatility Squeeze
From the 4-hour chart, LINK/USDT is in a minor bullish divergence attempt near the $8.85 mark with several bullish candle developments. However, the stochastic oscillator provides a structural view of the impending move in the coming session as lines operate deeply into the overbought region.
To this end, with the squeeze in the band space, a slight pullback before a move into the $9-$10 range would be recorded.
You can purchase crypto coins here. Buy Crypto

