Solana (SOL) Price Prediction: SOL/USDT Price Action Retains Upside Path
Estimated Reading Time: 3 minutes
Don’t invest unless you’re prepared to lose all the money you invest. This is a high-risk investment and you are unlikely to be protected if something goes wrong. Take 2 minutes to learn more
The Solana market has seen significant price increases in recent times. However, recently, the market saw a moderate downward retracement that stayed above important technical landmarks. Therefore, it still seems very possible that the market soon resume its upside correction through higher price levels in subsequent sessions.
SOL/USDT Long-Term Trend: Bearish (Daily Chart)
Key Price Levels:
Resistance: $250, $275, $300
Support: $225, $200, $175
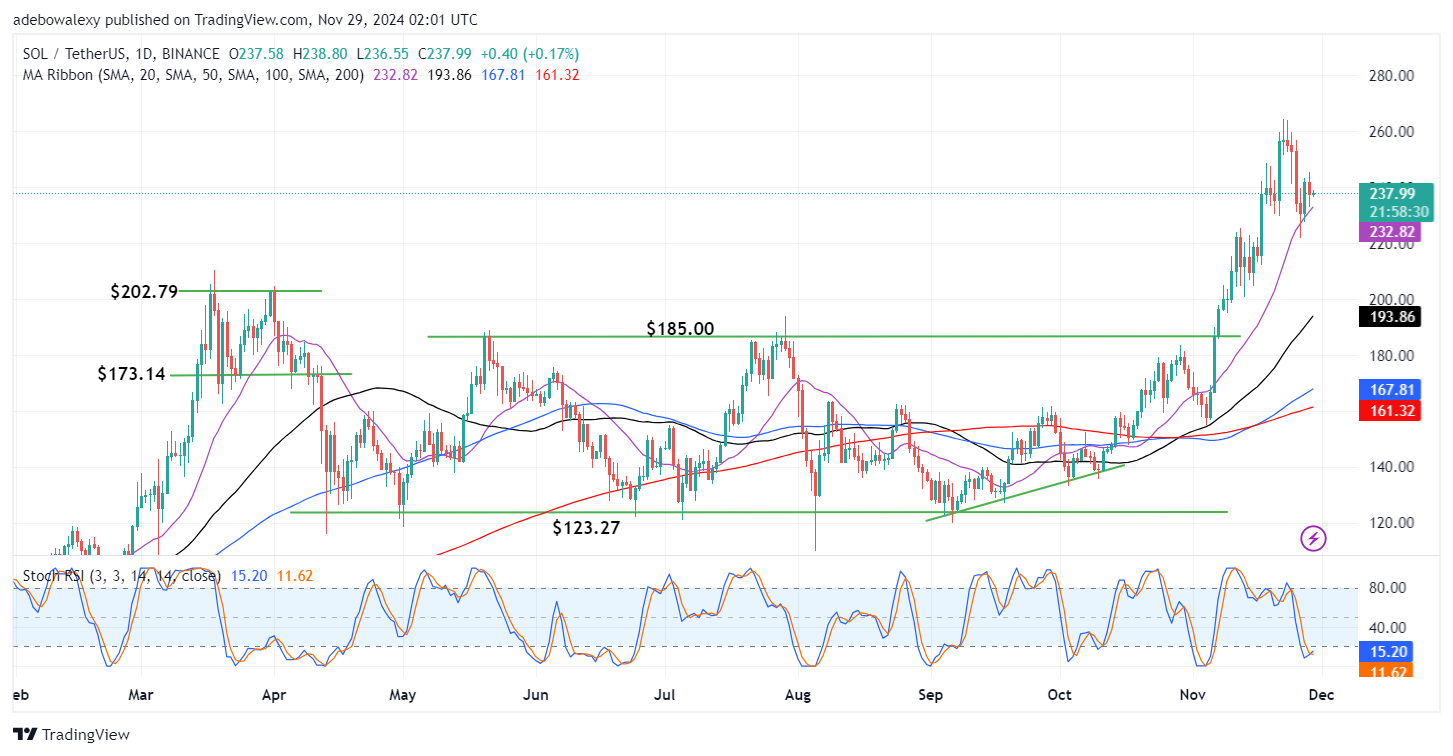
The price candle corresponding to the ongoing session has appeared above all the Moving Average (MA) lines. Likewise, the mentioned price candle has a bullish appearance, despite its small body size. At the same time, an upside crossover can be observed on the Stochastic Relative Strength Index (RSI) indicator. It is worth noting that the seen upside crossover is in the overbought region.
Solana (SOL) Price Prediction: SOL/USDT Upside Hopes Are Kindling
The position of the last price candle in the Solana daily market surely looks like a light at the end of the tunnel for bullish traders. Also, it suggests that price action isn’t ready to fall below important technical landmarks as it keeps the market above all the MA lines on the chart. Simultaneously, the Stochastic RSI indicator has just delivered an upward crossover in the depth of the oversold region.
This coincides with the appearance of a bullish price candle on this chart, hinting at a possible continued upside correction towards higher price levels. The seen upside crossover has strengthened bullish anticipations in this market, albeit a little at the moment.
Solana (SOL) Price Prediction: SOL/USDT Bulls Are Resilient (4-Hour Chart)
Moving to the Solana market’s 4-hour price chart, it is clearly expressed that upside forces are setting in again. Here, it could be perceived that buyers have been positively impacting the market for the past two sessions till now. The last three price candles on the chart are green. Also, they have steadily raised the market back above the 20- and 100-day MA lines.
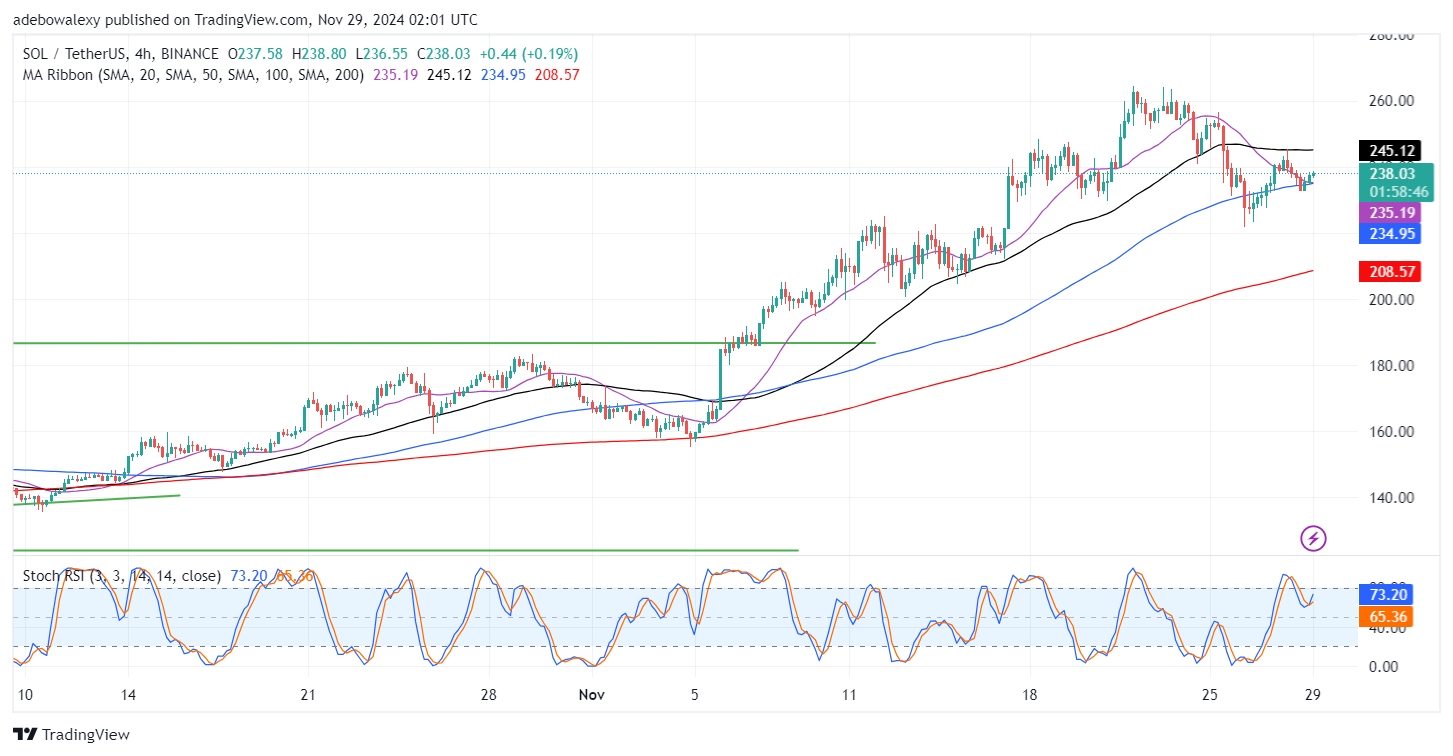
Likewise, the mentioned indicator lines can be seen converged below the last three price candles on this chart. The Stochastic RSI too has delivered an upside crossover not too far below the 80 mark. Also, the trajectory of the ensuing lines is upwards, thereby hinting that upside forces are active and may propel the market upwards toward the $250 mark.