SPONGE/USD ($SPONGE) Falls Deeper Into the Demand Zone
Estimated Reading Time: 2 minutes
Don’t invest unless you’re prepared to lose all the money you invest. This is a high-risk investment and you are unlikely to be protected if something goes wrong. Take 2 minutes to learn more
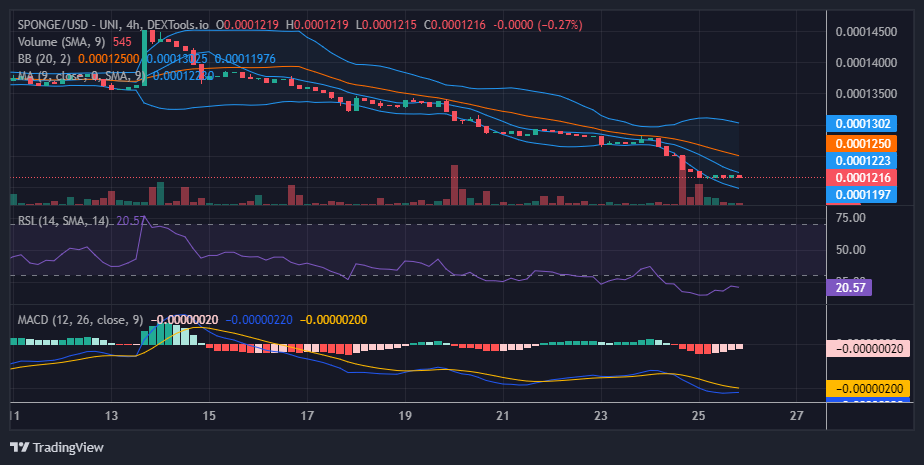
In the previous trading session, the bulls lost grip of the market at a near resistance level to the price level they adopted as their support. A strong bear market was triggered at this point, making the SPONGE/USD market fall below the support level. Currently, the bulls seek refuge slightly above the $0.00012 price level.
Key Levels
- Resistance: $0.0004, $0.0045, and $0.0005.
- Support: $0.00012, $0.00011, and $0.00009.
Sponge (SPONGE/USD) Price Analysis: The Indicators’ Point of View
Observing the support forming around the $0.00012 price level, we can see that the Bollinger Bands indicator displays a more divergent lower standard deviation line. This divergence is a result of increased liquidity in the SPONGE/USD bear market over the past 24 hours. Nevertheless, there are indications that the market might be on the verge of a reversal around $0.0001216, signaling a potential upward movement.
The Relative Strength Index (RSI) supports this view, as it shows the market in the oversold section. The current oversold condition implies that the market is being excessively sold off, suggesting an imminent upward price correction.
Overall, the market’s technical indicators suggest the possibility of a bullish reversal shortly. Traders should be attentive to potential buying opportunities as the market shows signs of bouncing back from the current support level.
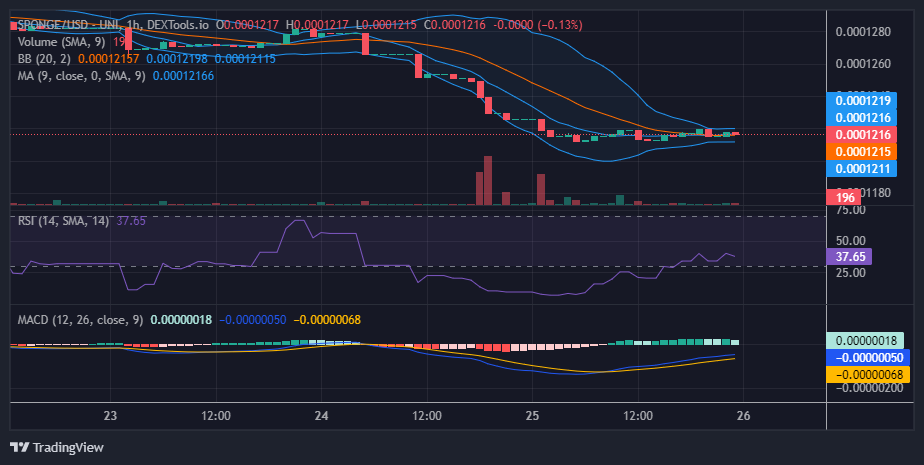
SPONGE/USD Short-Term Outlook: 1-Hour Chart
In the 1-hour timeframe, the narrow price channel indicates that the market is coiling, creating the potential for a bullish breakout, particularly as this new market development occurs near a crucial support level. Traders should be ready for a significant move when the price breaks out of the channel.
Start trading $SPONGE on Poloniex today!
Calling all #SPONGERS! 🧽🌊
Start trading $SPONGE on @Poloniex today! 💸🚀
Get ready to soak up the excitement! 🌊🌟https://t.co/1Fq3Nsz7do pic.twitter.com/WqR6SHS6cj
— $SPONGE (@spongeoneth) July 25, 2023
Invest in the hottest and best meme coin. Buy Sponge ($SPONGE) today!