XRP Hits a Low of $0.48 as It Reaches Bearish Fatigue
Estimated Reading Time: 2 minutes
Don’t invest unless you’re prepared to lose all the money you invest. This is a high-risk investment and you are unlikely to be protected if something goes wrong. Take 2 minutes to learn more

XRP (XRP) Long-Term Analysis: Bearish
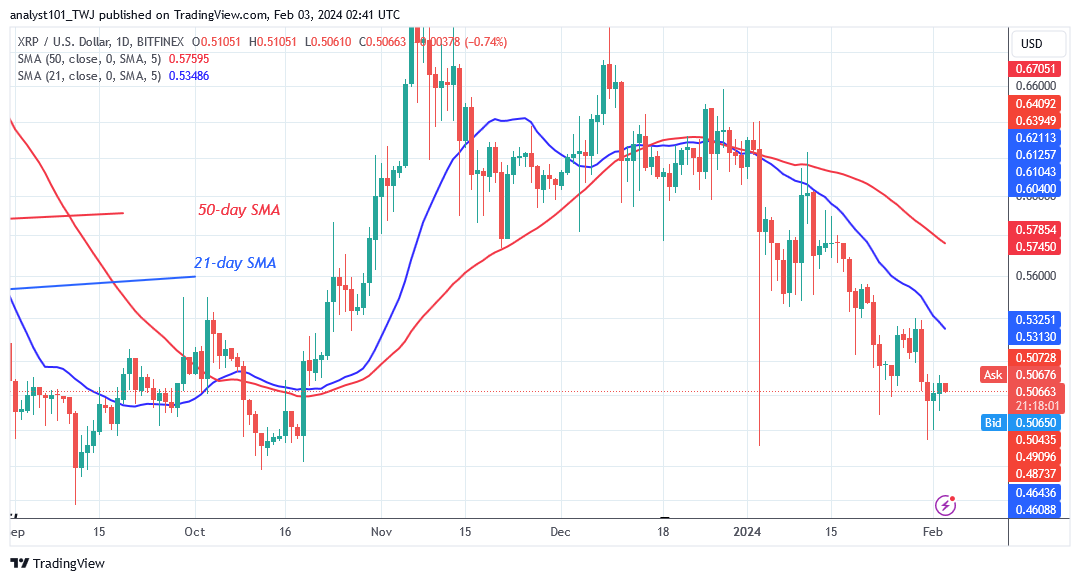
XRP’s (XRP) price has plummeted to the bottom of the chart as it reaches bearish fatigue. The crypto asset has reached negative fatigue after rising above the $0.48 support. The current support is the historical price level of October 12, 2023. Buyers have protected the historical price level as the altcoin regains upward momentum. Today, XRP has dropped to the bottom of the chart.
The altcoin is trading above $0.48 but below the resistance of $0.54. Long candlestick tails at the bottom of the chart signal that there is considerable buying pressure. On the upside, the altcoin’s positive momentum will resume if buyers retain the price above the moving average lines.
Technical Indicators:
Major Resistance Levels – $1.00, $1.50, $2.00
Major Support Levels – $0.50, $0.30, $0.10
XRP(XRP) Indicator Analysis
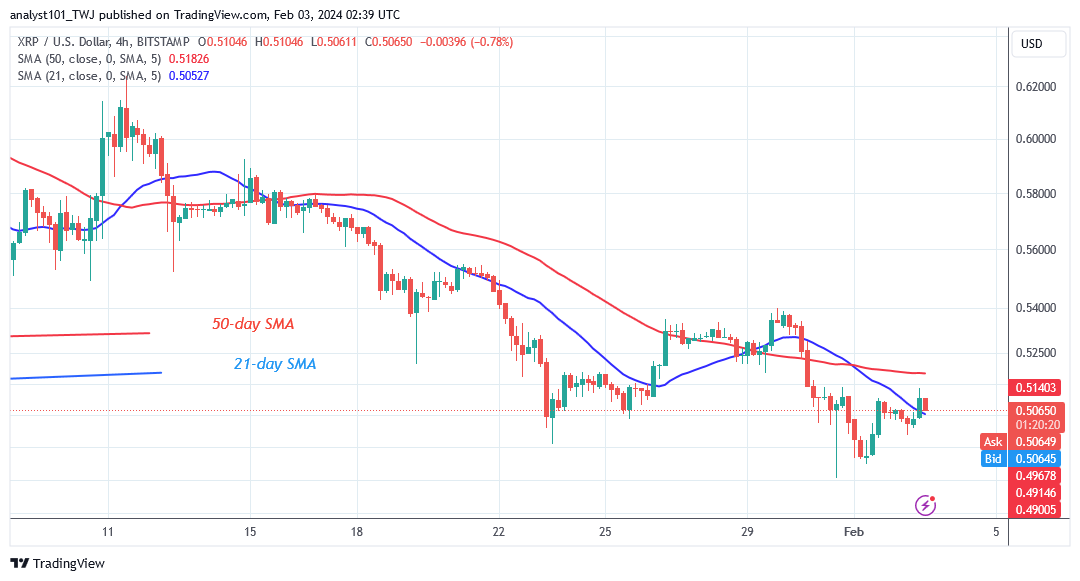
The moving average lines point south to the bottom of the chart and are above the price bars. The 21-day SMA serves as the price bars’ resistance line. The price action is now dominated by Doji candlesticks, limiting price fluctuation.
What Is the Next Direction for XRP (XRP)?
XRP/USD is falling towards the bottom of the chart as it reaches bearish fatigue. The crypto’s price has been fluctuating between lower highs and lower lows. The moving average lines have restrained the upward movement. The altcoin is now trading in the $0.48 to $0.54 price range. Crypto signals have remained bearish as the altcoin moves near the bottom of the chart.
The altcoin’s price has varied between $0.48 and $0.54 within the past week.
You can purchase crypto coins here. Buy LBLOCK
Note: Cryptosignals.org is not a financial advisor. Do your research before investing your funds in any financial asset or presented product or event. We are not responsible for your investing results
