Dogecoin Price Prediction: DOGE/USDT Leans Heavily on the $0.2396 Support
Estimated Reading Time: 3 minutes
Don’t invest unless you’re prepared to lose all the money you invest. This is a high-risk investment and you are unlikely to be protected if something goes wrong. Take 2 minutes to learn more
Dogecoin Price Prediction (February 23)
The Dogecoin market has remained depressed below key short-term technical indicators. However, more recently, price action has begun leaning heavily against a critical technical level that could lead to further downside movement if breached.
DOGE/USDT Long-Term Trend: Bearish (Daily Chart)
Key Price Levels:
Resistance: $0.2500, $0.3000, $0.3500
-Support: $0.2000, $0.1500, $0.1000
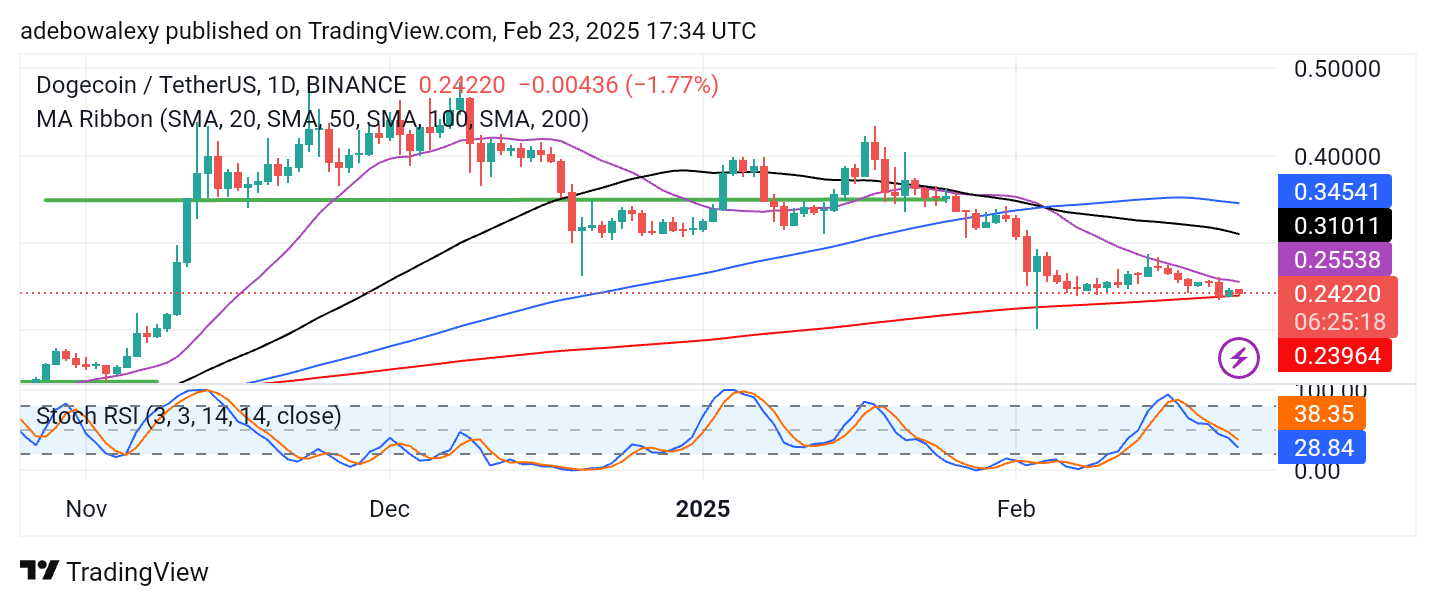
For the past two sessions, price action has been testing the final line of defense at the 200-day Moving Average (MA). The last price candle has appeared red, keeping the market pressed against the 200-day MA line.
Meanwhile, price action remains below the 20-day MA, further confirming bearish sentiment. Additionally, the Stochastic Relative Strength Index (RSI) lines are trending downward below the 40 level, suggesting increasing selling pressure.
Dogecoin Price Prediction: DOGE/USDT Market Prepares to Break Key Support
Dogecoin’s Price action has remained below the 20-day, 50-day, and 100-day MA lines, but more significantly, it has also been hovering near the 200-day MA curve.
In the ongoing session, DOGE/USDT appears to be on the verge of breaking below this major support level. Furthermore, the Stochastic RSI lines are moving downward toward the oversold region, signaling continued bearish momentum.
Additionally, close observation reveals divergence at the terminal points of the Stochastic RSI lines, which technically suggests that downward forces may overpower support and push prices lower.
Dogecoin Price Prediction: DOGE/USDT May Fall Below $0.2400 (4-Hour Chart)
On the 4-hour chart, price action has fallen below all key MA lines. However, the last price candle of the ongoing session has turned green after bouncing off the $0.2400 support level.
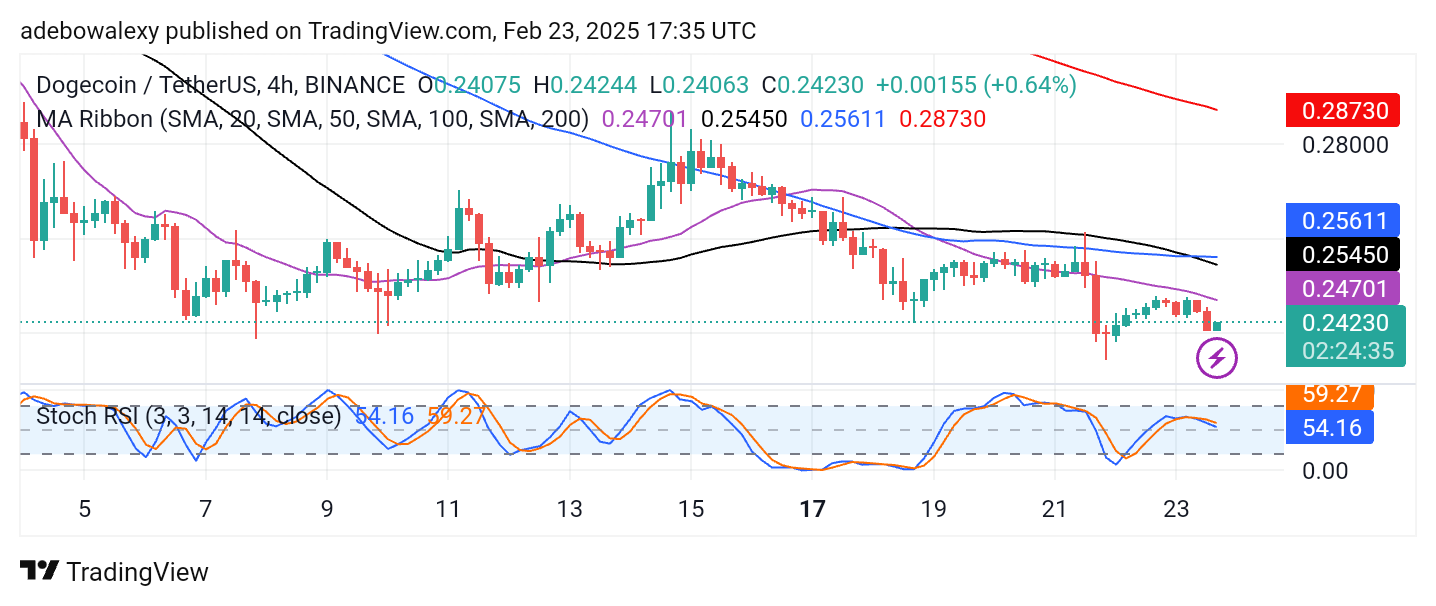
Despite this temporary rebound, the Stochastic RSI lines continue to fall into the oversold region, with the leading line nearing the 50 level of the indicator.
Technical indications suggest that this market may continue to trend lower. Given that price action is below all MA lines and the RSI maintains a bearish trajectory, downward pressure could force DOGE/USDT to breach $0.2400 and move toward the $0.2300 price level.