Ethereum (ETH/USD) Bullish Traders Seek to Regain the Market
Estimated Reading Time: 3 minutes
Don’t invest unless you’re prepared to lose all the money you invest. This is a high-risk investment and you are unlikely to be protected if something goes wrong. Take 2 minutes to learn more
Ethereum Long-term Analysis: Bullish
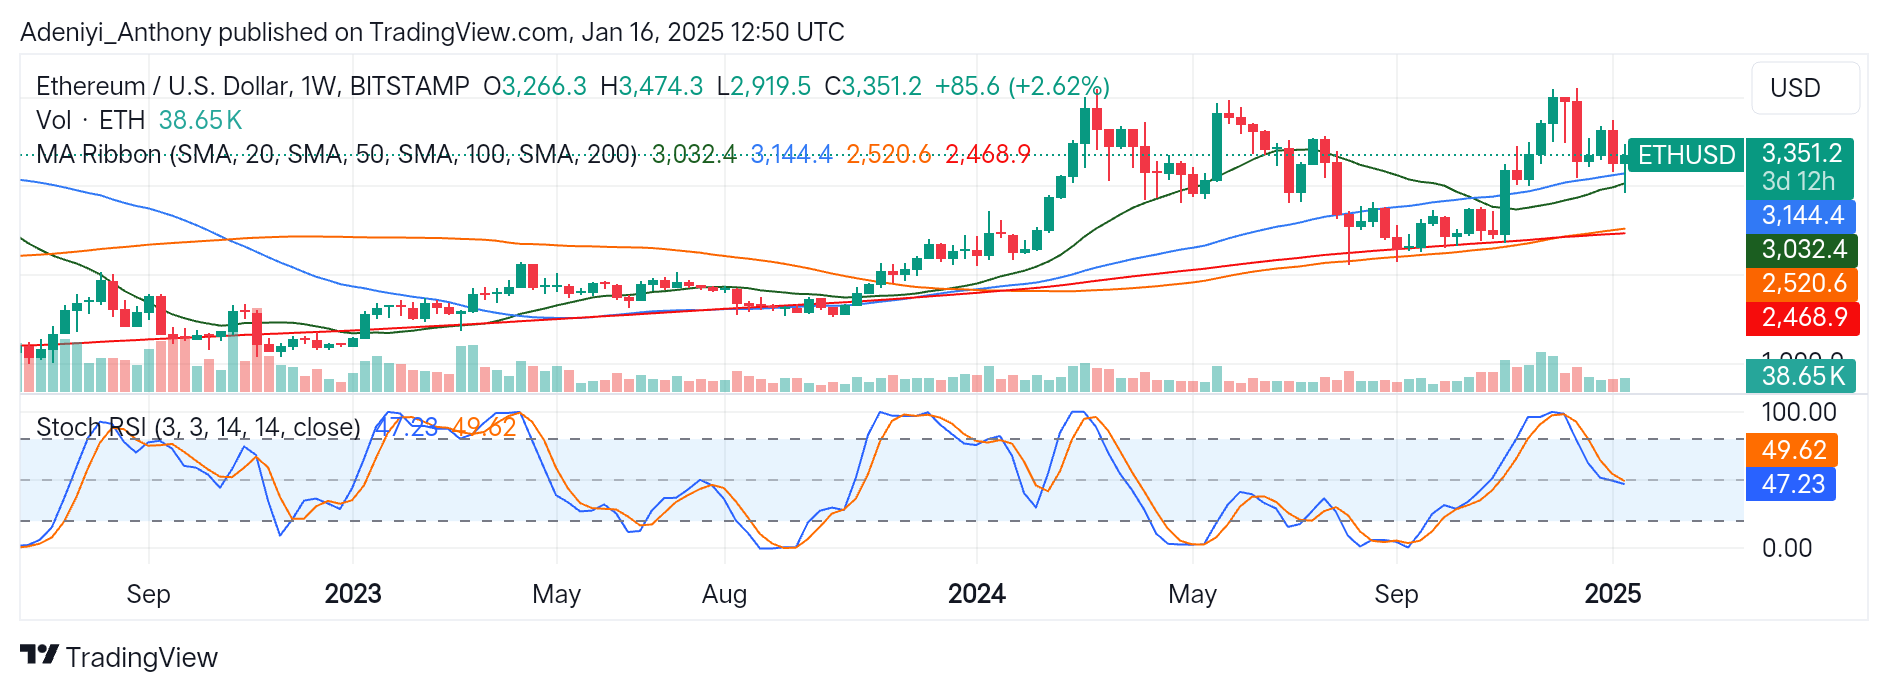
Ethereum, in the weekly timeframe, has been showing strong signs of recovery. This is buoyed by renewed confidence as Ethereum against the United States dollar charts a new direction.
Recently, Ethereum has experienced a notable uptick as its price increased by 2.62% for the week. However, this action suggests the pair’s ability to reclaim previous highs as the price trades above key moving averages. Expectations for recovery are now hinged on the coin’s ability to break above critical resistance levels while maintaining the current support outlook.
Currently, ETH/USD trades at $3,351.2 after opening at $3,266.3 this week.
Technical Indicators
Major Resistance Levels: $3,474, $3,700, and $4,000
Major Support Levels: $3,144, $3,032, $2,520
Ethereum Technical Analysis
While the market for Ethereum is leaning bullish, the analysis shows that the pair is extending toward previous highs as the price trades above the moving average ribbons. However, as the longer-period moving averages turn to the North, ETH/USD signals a longer-term bullish trend only if momentum is maintained.
On the other hand, the Stochastic RSI indicates a neutral position for the pair. However, a confirmed move above the 50-mark level would cement the recovery; otherwise, the pair might experience a minor dip.
To this end, a break above $3,474 is crucial for the current upside movement; otherwise, a retracement below $3,280 would suggest a move toward the immediate support level.
ETH/USD Analysis: What to Expect
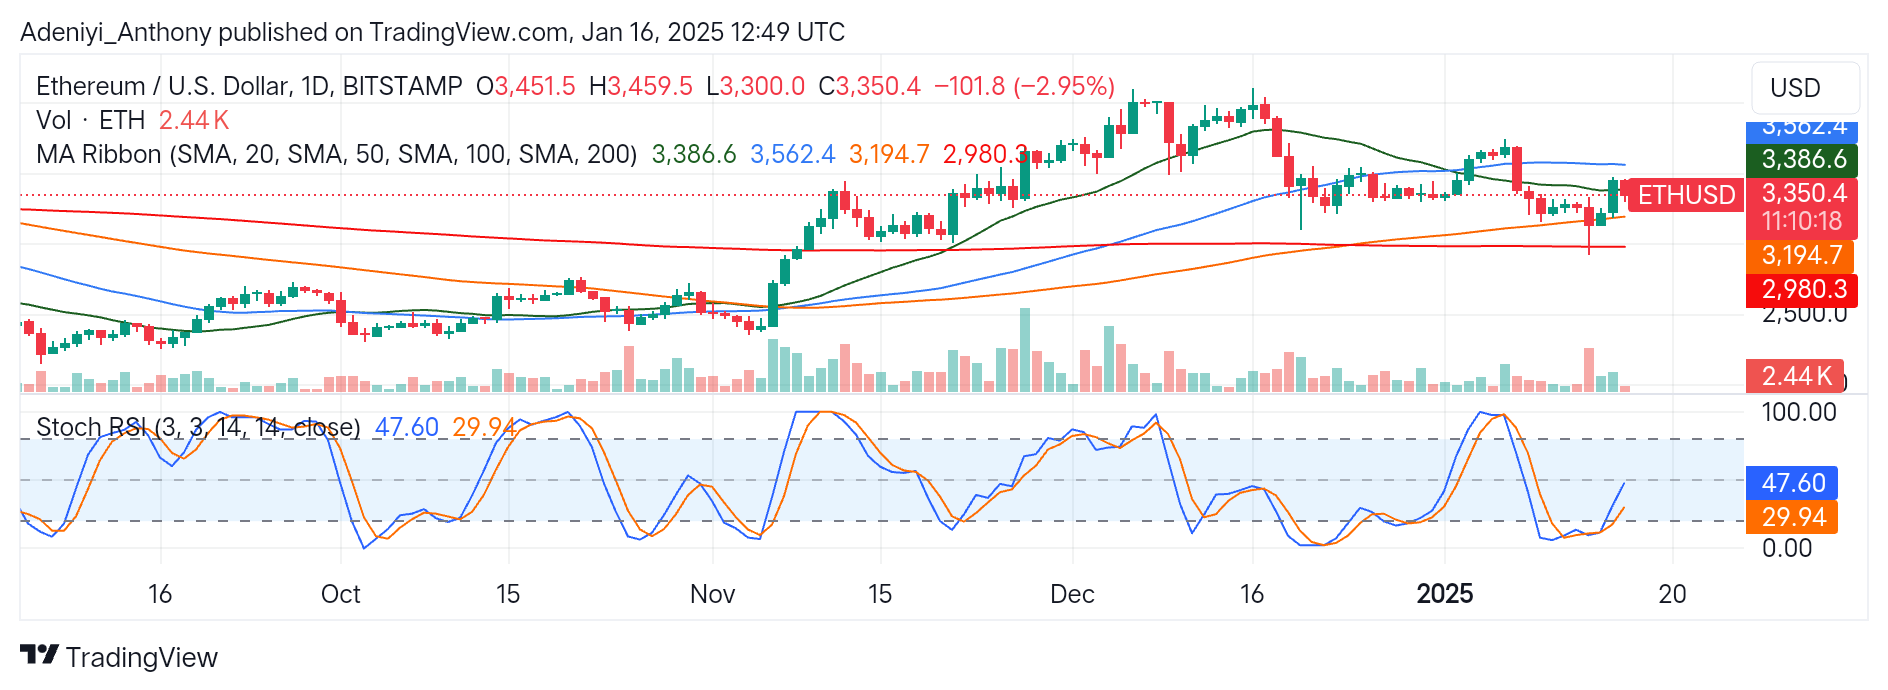
On the daily timeframe, ETH/USD leans towards a neutral to bearish tone as the price drops by 2.95% from the previous session. This indicates the pair is acting under selling pressure in a shorter timeframe.
However, the price’s appearance between the shorter and longer moving averages indicates that the current market is bearish in the short term, as the price ranges below the 50-day average.
On the other hand, the upward-moving oscillator’s lines signal early signs of potential recovery. However, confirmation is needed above the 50-mark level. Contrarily, a fall in momentum would indicate a further dip in the price level.
You can purchase crypto coins here. Buy LBlock