Uniswap (UNI) Price Prediction: UNI/USDT Sees Moderate Downward Rejection
Estimated Reading Time: 3 minutes
Don’t invest unless you’re prepared to lose all the money you invest. This is a high-risk investment and you are unlikely to be protected if something goes wrong. Take 2 minutes to learn more
Uniswap Price Prediction for November 28
The Uniswap token has seen a moderate downward retracement in today’s trading activity. Despite this, price action now trades at a price level last seen in April. What’s more, price action can be seen standing above important technical landmarks that hint at the possibility of additional price increases.
UNI/USDT Long-Term Trend: Bearish (Daily Chart)
Key Price Levels:
Resistance: $14, $16, $18
Support: $12, $10, $8
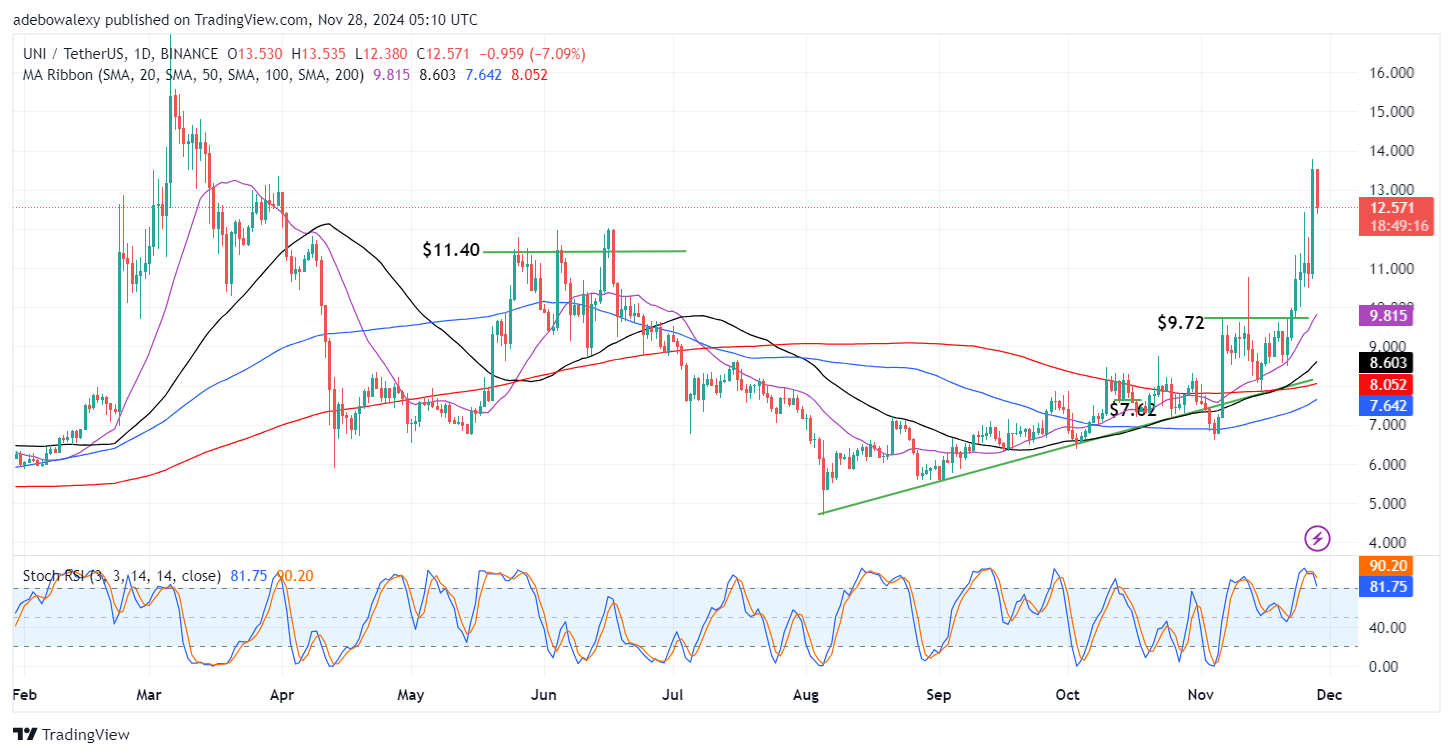
The price candle corresponding to the current session has appeared bearish. Also, considering the size of the price candle, it has produced a moderate price downward correction. However, trading activity in this market yet stands at a significant distance above all the Moving Average (MA) curves. Even the Uniswap token precisely trades above the $12 mark. Meanwhile, the Stochastic Relative Strength Index (RSI) lines can be seen falling steeply toward the 80 level of the indicator.
Uniswap (UNI) Price Prediction: UNI/USDT Bulls Are Still More Likely to Resume Upside Corrections
Price action in the UNI/USDT market has over the previous session, gained massive bullish traction. The previous session was one of the sessions during which some massive price increases were recorded. However, this seems to have drawn the attention of downward forces, resulting in a downward retracement in the ongoing session. But all thanks to the massive price increases over the past session, the market now trades above all of the MA curves.
On the contrary, the Stochastic RSI lines can be seen falling toward support at the 80 mark of the indicator. Although this doesn’t look good, the lines still remain in the overbought region. Therefore, combining this with the position of the market above all the MA lines, it does seem that price action may resume upward soon.
Uniswap (UNI) Price Prediction: UNI/USDT Upside Rebound Begins (4-Hour Chart)
While the Uniswap price chart has revealed bearish activity, the 4-hour market can be seen presenting the fact that price action has started staging an upward rebound. The last price candle on this 4-hour chart can be seen appearing green but with a small body. However, the Stochastic RSI lines are still descending lower, below the 80 mark. Nevertheless, price action stays above all the MA lines.
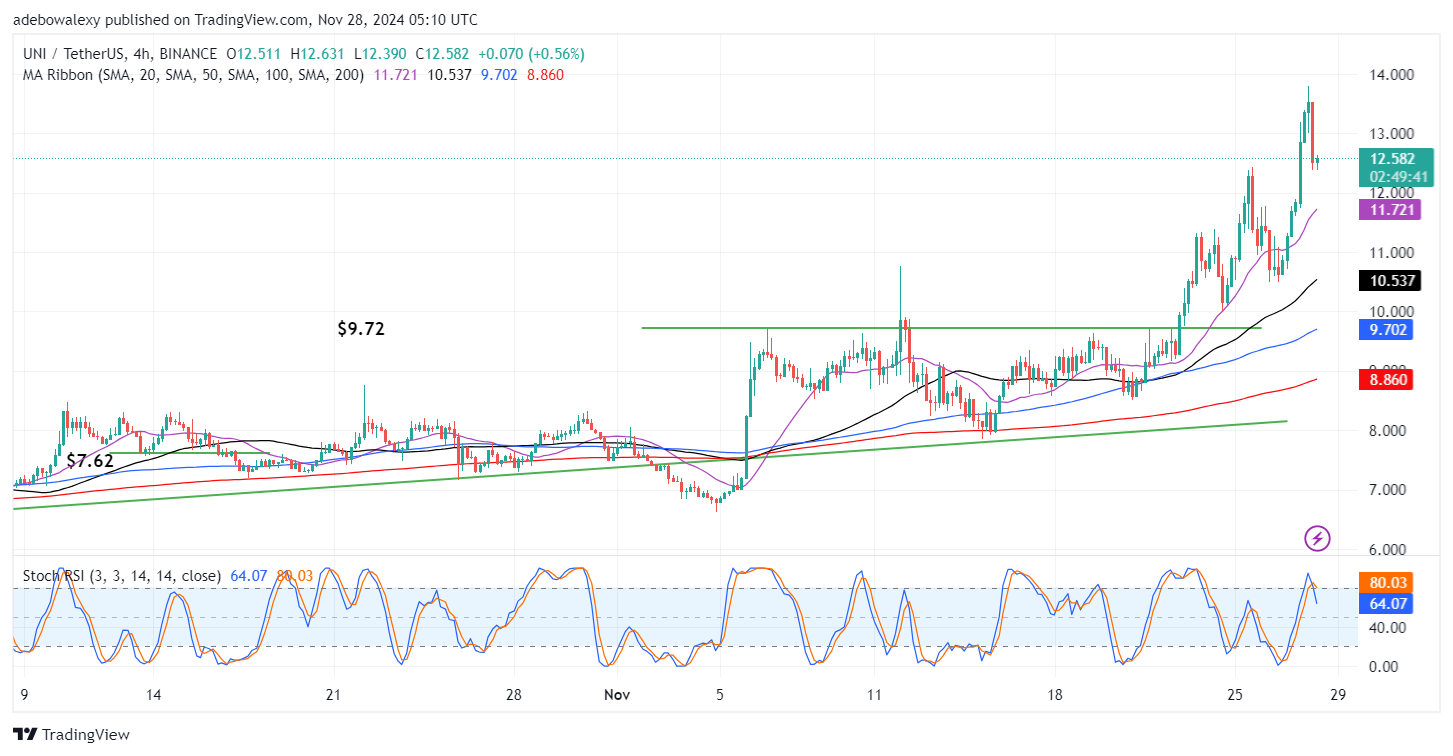
Considering the fact that the upside rebound has started above all the MA lines, the chances that the move will survive are quite high. This is so despite the downward trajectory of the Stochastic RSI lines. As a result, traders can eye the $13 price mark for short-term gains, even though the upside correction may resume toward the $14 mark.