$SPONGE (SPONGE/USD) Surges as Market Targets Stronger Support Above $0.000045
Estimated Reading Time: 3 minutes
Don’t invest unless you’re prepared to lose all the money you invest. This is a high-risk investment and you are unlikely to be protected if something goes wrong. Take 2 minutes to learn more

In today’s trading outlook for the $SPONGE market, the price action continues to exhibit a strong upward trajectory, extending the positive momentum observed in the previous market analysis. Notably, today’s market performance has exceeded expectations. In the last analysis, we anticipated that the next resistance for the uptrend might be around the $0.00004 level. However, the market has surpassed this level and is now attempting to establish higher support above $0.000045.
Key Market Dynamics:
- Resistance Levels: $0.0010, $0.0011, $0.0012
- Support Levels: $0.000020, $0.0000195, $0.000019
$SPONGE (SPONGE/USD) Technical Outlook
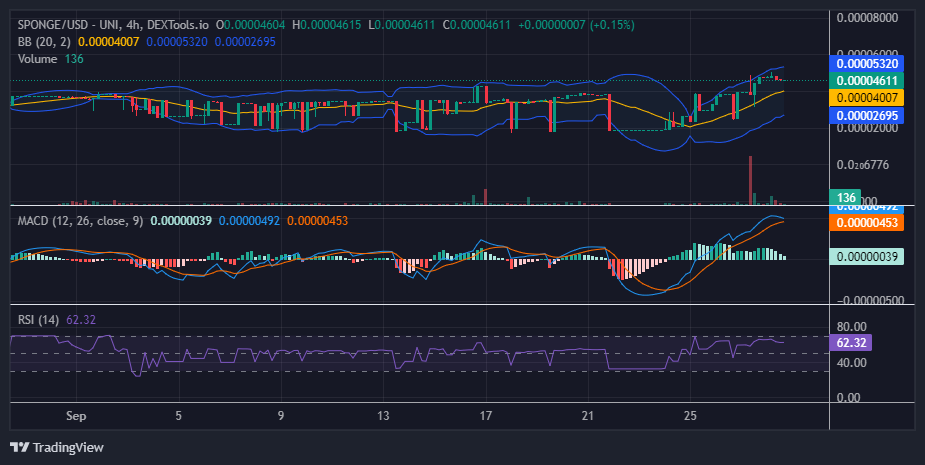
The $SPONGE market has demonstrated a strong upward trend, pushing the price above the critical $0.000045 level. The market briefly reached $0.00005 before a price correction was triggered. From the 4-hour chart, we observe that the bearish movement, which began after hitting the $0.00005 mark, is losing momentum near the $0.000045 level. As the market approaches this threshold, the action of the crypto signal has flattened, suggesting that the bearish momentum may be waning, and bullish sentiment could still be prevalent.
The Bollinger Bands continue to illustrate an upward-trending price channel. However, the Moving Average Convergence Divergence (MACD) is showing signs of a slowdown, with the faster MACD line turning downward and the height of the histograms decreasing. This may indicate a potential consolidation at the current price level before the market either resumes its upward movement or determines its next direction.
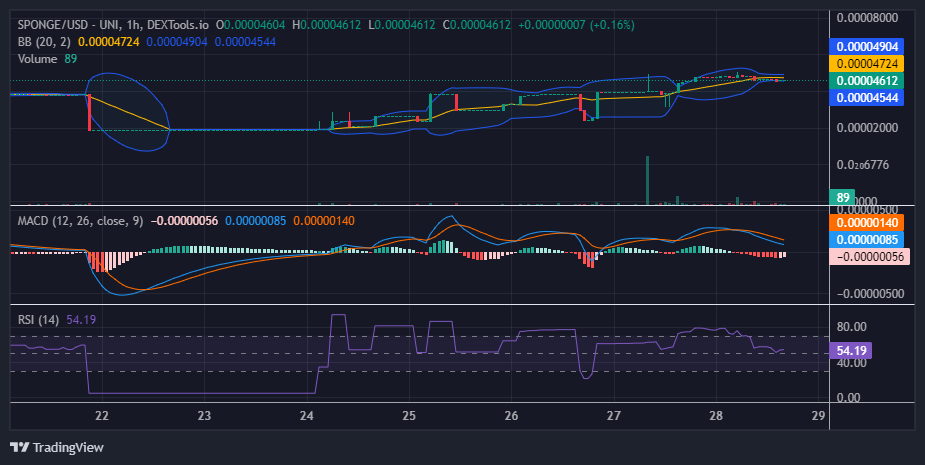
$SPONGE (SPONGE/USD) 1-Hour Chart Insights
In the shorter time frame, the market is consolidating above $0.000045. After a period during which demand and supply reached equilibrium, market volatility has decreased. As a result, the Bollinger Bands have narrowed, forming a tight price channel around the horizontal price action at $0.000046.
Analyzing the Moving Average Convergence Divergence (MACD) indicator, we observe that a bearish crossover has already occurred, with initially strong negative histograms reflecting the divergence between the two MACD lines. However, the fading red histograms and the reduction in their height suggest that bullish momentum may be reemerging, as the declining histogram height points to a potential resurgence of buying pressure in the market.
Buy $SPONGE!
Watch your step ⚡️ pic.twitter.com/zU2ydTKcCs
— $SPONGE (@spongeoneth) September 27, 2024
Join the SPONGE community and be part of the next big crypto sensation! Buy Sponge ($SPONGE) today!