SPONGE/USD ($SPONGE) Holds Above $0.00011 as Market Awaits Major Price Move
Estimated Reading Time: 3 minutes
Don’t invest unless you’re prepared to lose all the money you invest. This is a high-risk investment and you are unlikely to be protected if something goes wrong. Take 2 minutes to learn more

The $SPONGE market has consistently maintained its position above the key $0.00011 level following a recent breakout. The price action has since remained stable, consolidating in a narrow range just above this critical support zone. This sustained position suggests that bullish sentiment continues to dominate market dynamics.
Despite the current resilience shown by the bulls, technical indicators hint at a potential short-term correction. However, the recent upward momentum could lead to the establishment of a higher support level. If this occurs, it may create a stronger foundation for the next bullish leg, giving traders an opportunity to re-enter the market from more favorable positions.
Key Technical Levels
- Resistance: $0.000115, $0.000120, $0.000130
- Support: $0.000090, $0.000085, $0.000080
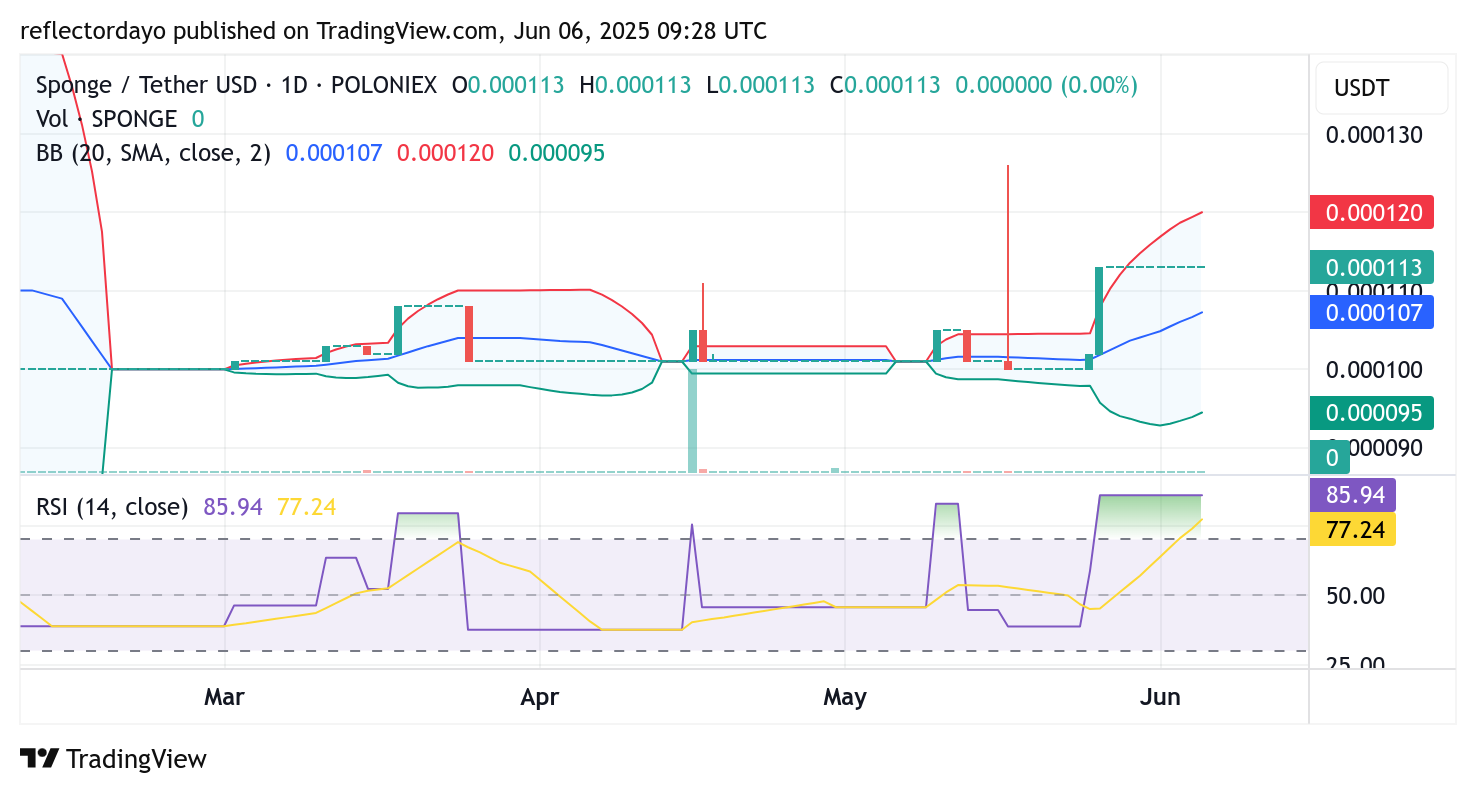
SPONGE/USD Daily Chart: Indicators Signal Bullish Progress Amid Volatility
Despite a period of sideways consolidation, the $SPONGE market continues to exhibit notable volatility. Although intraday price swings have moderated, the daily Bollinger Bands remain wide—an indication that the overall market environment is still highly active and unstable.
A closer look at the Bollinger Bands reveals a telling development: the lower band is gradually curving upward, aligning toward the current consolidation zone. This upward shift from the lower end suggests that price action is stabilizing from below, reinforcing the strength and persistence of the ongoing bullish trend.
However, a short-term correction appears likely. The Relative Strength Index (RSI) is currently in overbought territory, signaling that the market may be due for a temporary pullback. Still, if bulls manage to defend a higher support level during the correction, it would further validate the strength of the upward trend and potentially set the stage for the next leg higher.
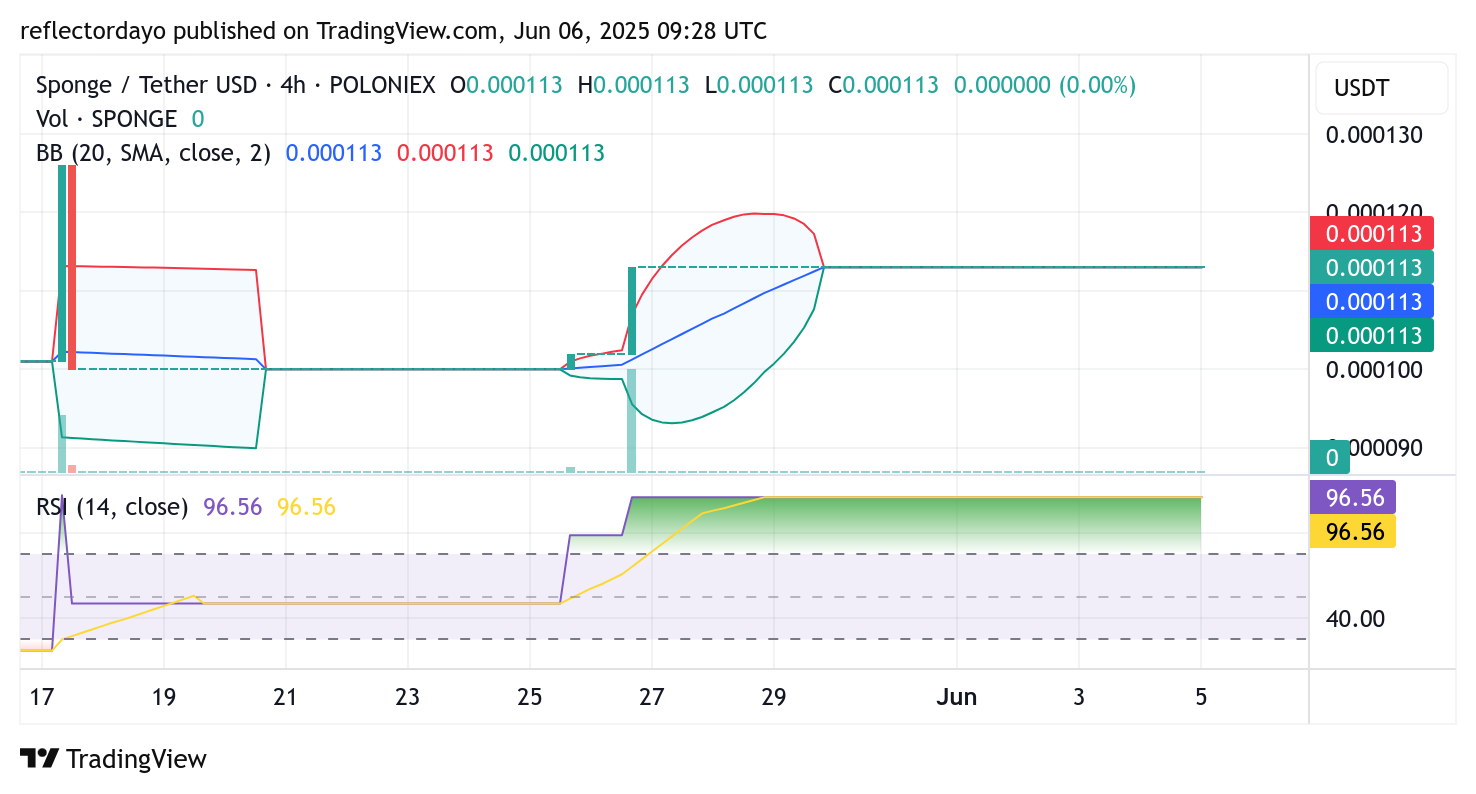
SPONGE/USD 4-Hour Chart: Volatility Squeeze Points to Potential Breakout
While the daily chart reflects broad market volatility, the 4-hour timeframe presents a different scenario—one of tightening Bollinger Bands. This classic volatility compression often precedes a significant price move, indicating that SPONGE/USD may be on the verge of a breakout.
Supporting this outlook, the Relative Strength Index (RSI) on the 4-hour chart is currently hovering around 96, signaling extremely strong bullish momentum. Although such a high RSI suggests the market is overbought and may be due for a short-term pullback, it also confirms the dominant presence of bullish pressure.
If a minor correction occurs, bulls could re-enter at a higher support level, strengthening the market structure and potentially igniting the next upward leg. With buying activity still robust, the current setup favors continuation—provided support holds firm.
Buy SPONGE/USD!
The markets will never let you go 🧽💦 pic.twitter.com/SPFvl5X8Od
— $SPONGE (@spongeoneth) June 4, 2025
Join the SPONGE community and get in on the next big crypto opportunity! Buy Sponge ($SPONGE) today