Polygon (MATIC/USD) Price Lacks Index Signal, Hovering at $0.50
Estimated Reading Time: 3 minutes
Don’t invest unless you’re prepared to lose all the money you invest. This is a high-risk investment and you are unlikely to be protected if something goes wrong. Take 2 minutes to learn more
Polygon Price Prediction – September 18
The ups and downs in the transaction line surfacing between Polygon and the US currency have shown the crypto-economic trade lacks an index signal, hovering at $0.50.
During this time, a high trend indicator of a smaller moving average at $0.549 and the horizontal line drawn beneath it at $0.50 have been perceived to be the embodiment of the sinking force that has affected the entire trading environment. The subsequent upward force that aims to test the previous value will return a trait of running back a path toward constructing support from a subsequent lower point.
MATIC/USD Market
Key Levels:
Resistance levels: $0.60, $0.65, $0.70
Support levels: $0.45, $0.40, $0.35
MATIC/USD – Daily Chart
The MATIC/USD daily chart showcases that the crypto-economic price lacks an index signal, hovering at $0.50.
The 14-day SMA indicator is underneath the 50-day SMA indicator, which is at $0.656, positioning above. The second horizontal line drawn marks $0.60 as the major barrier-trading line in the near future. The stochastic oscillators have initially penetrated the overbought region, ranging from 82.38 to 78.22. Buyers pushing the capacity rate currently appear elusive, as it cannot be witnessed in the near future.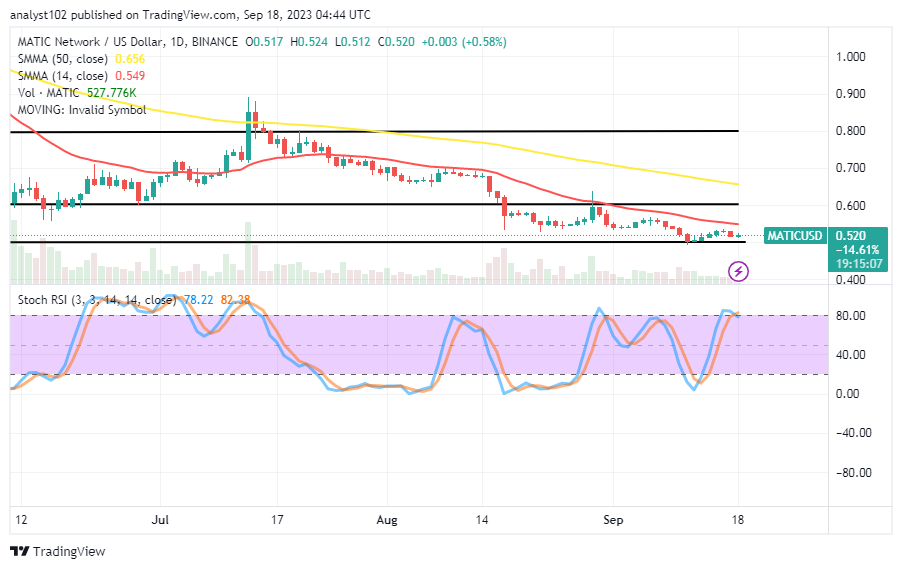
What is the likelihood that the MATIC/USD market will continue to trade below the SMAs?
Presently, the trade situation between the market movers tends to risk pushing between the point of the smaller moving average and the horizontal draw at $0.50 for a while as the MATIC/USD price lacks an index signal, hovering at $0.50.
When the price reached a lower trading level of $0.50 only a week ago, bulls gradually gained momentum toward a recovery motion, making it difficult to achieve. In short, a long-position placer must wait a while before steadily and upwardly moving back.
Every sign still points to the possibility of a depression force emerging with a less-active motion coming from the smaller moving average point. Given that there might not be consistent fall-offs against the $0.50 value line, a circumstance exhibiting an oversold reading condition doesn’t seem too far-fetched. If that assumption must be made, buyers are advised to keep an eye out for a rebound.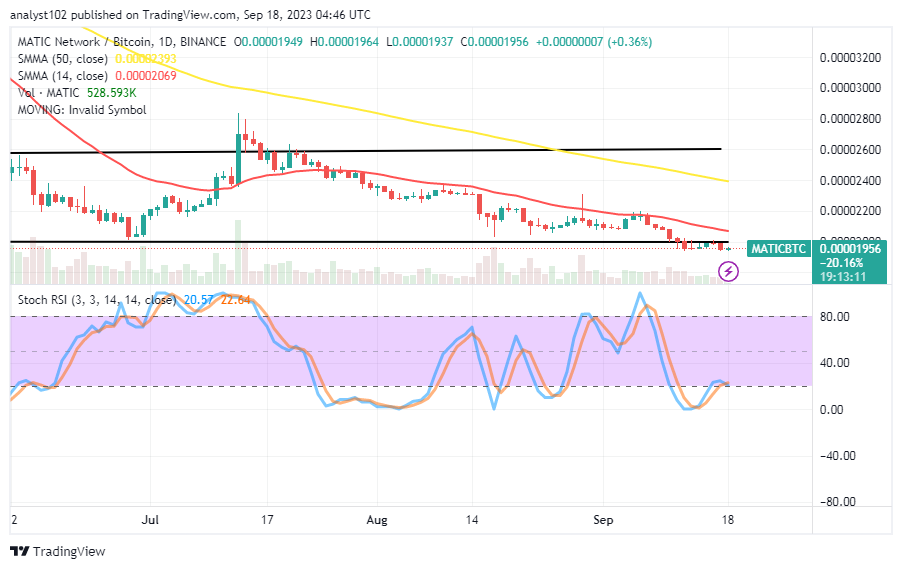
MATIC/BTC Price Analysis
In comparison, the Polygon market currently showcases that it lacks an index signal against Bitcoin, hovering at a lower-trading spot on the moving averages.
Underneath the 50-day SMA indication is the 14-day SMA indicator. Below the horizontal line drawn below the moving averages, a few lower lows have briefly appeared. The initial decline in the oversold zone of the stochastic oscillators However, they are currently attempting to briefly cross back southward from 22.64 to 20.57 values. However, it doesn’t appear as though the downward motion is carrying much weight.
Note: Cryptosignals.org is not a financial advisor. Do your research before investing your funds in any financial asset or presented product or event. We are not responsible for your investing results.
You can purchase Lucky Block here. Buy LBLOCK