Polygon (MATIC/USD) Trade Has a Correction, Averaging $0.50
Estimated Reading Time: 3 minutes
Don’t invest unless you’re prepared to lose all the money you invest. This is a high-risk investment and you are unlikely to be protected if something goes wrong. Take 2 minutes to learn more
Polygon Price Prediction – September 10
The inability of the MATIC/USD market operation to surge higher beyond the resistance of $0.60 at the close point has metamorphosed into letting the crypto trade into a correction situation, averaging the lower support of $0.50 at present.
A gradual and steady motion has been used in the downward-falling impulse. And in doing so, it would be a little more challenging for sellers to place a shorting position order because the market has already moved into lower trading ranges, where long-term bears are more susceptible to a quick whipsaw. In a real sense, a good cycle will soon be created toward having a good re-buying strategy.
MATIC/USD Market
Key Levels:
Resistance levels: $0.60, $0.65, $0.70
Support levels: $0.45, $0.40, $0.35
MATIC/USD – Daily Chart
The MATIC/USD daily chart showcases that the crypto trade has a correction underneath the sell signal side of the smaller moving average, and it is averaging the support line of $0.50.
The 14-day SMA trend line’s value point of $0.573 is $0.680 above the 50-day SMA trend line. There have been two horizontal lines drawn between $0.60 and $0.50, marking them as the major contending trade points between bulls and bears. The stochastic oscillators have moved southward from a position of about 80 to one between 51.62 and 30.33.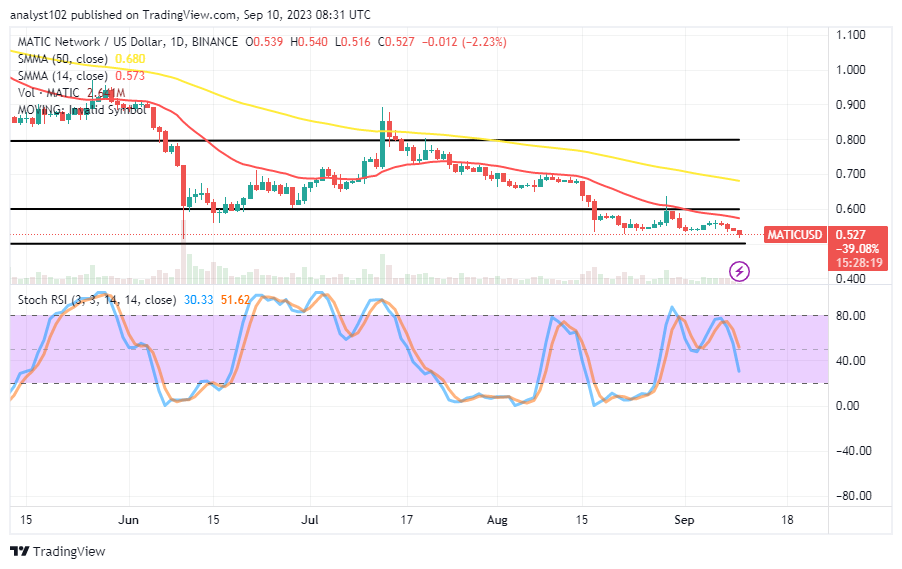
In MATIC/USD market activity, may aggressive falling pressure be applied against the $0.50 support line?
An eventual formation of a full-body bearish candlestick across the line of $0.50 in the transaction deals of the MATIC/USD will possibly produce lighter lows subsequently as the crypto’s price possesses a correction sign and is averaging the point in question.
As it has been over a couple of sessions below the trend lines of the SMAs, investors are expected to be buying from the dips ahead of witnessing a return of gravitation back to the upside. The moment that a rebound is tending to surface will be the ideal time for making a longing order.
Some situations have succumbed slightly to the side of price depression in the Polygon trade against the US coin. But, even at that, it is risky to play alongside those signs at their nascent time because the market’s worth has been pushed quite a while into the depths of reductions.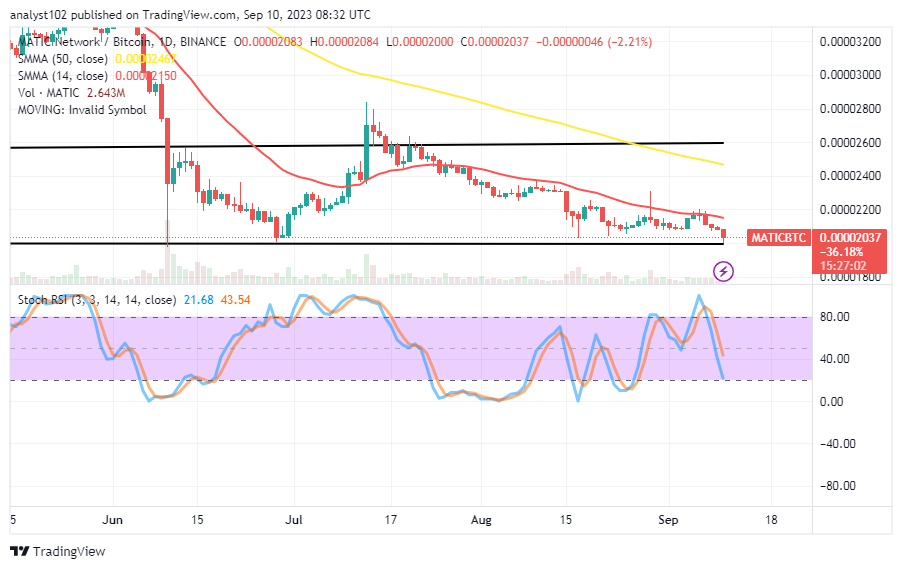
MATIC/BTC Price Analysis
In comparison, trending forces between Polygon trade and the Bitcoin market have been correcting and averaging the lower line below the horizontal line drawn below the trend lines of the moving averages.
The 50-day SMA indicator is far above the 14-day SMA indicator. As there has been a formation of a bearish candlestick to have touched the lower horizontal line drawn, it is expected that in the near future, there will be a positive-denoting type to invalidate further dropping motions against the base crypto economy. The stochastic oscillators are currently in a slight southbound-crossing mode, ranging from 43.54 to 21.68. That suggests that selling activities are rapidly heading toward completion.
Note: Cryptosignals.org is not a financial advisor. Do your research before investing your funds in any financial asset or presented product or event. We are not responsible for your investing results.
You can purchase Lucky Block here. Buy LBLOCK