Chainlink Price Faces Critical Compression Near Yearly Low
Estimated Reading Time: 3 minutes
Don’t invest unless you’re prepared to lose all the money you invest. This is a high-risk investment and you are unlikely to be protected if something goes wrong. Take 2 minutes to learn more

Chainlink price has recently gone down by 7.23% in recent times. This change shows that the token is slightly outpacing the broader market’s 6.17% decline. At the present time, the decline seems to be fueled by a wave of extreme fear across the crypto sector.
Technically, the decline accelerated after LINK failed to stay strong above the $10.41 support level, as the breakdown triggered heavy selling pressure and stop-loss liquidations.
Currently, Chainlink trades at $9.94 with a moderate 946,000 traded volume at the time of writing.
Technical Indicators
Major Resistance Levels: $11.10, $12.35, and $14.50
Major Support Levels: $9.50, $8.30, and $7.50
Technical Analysis
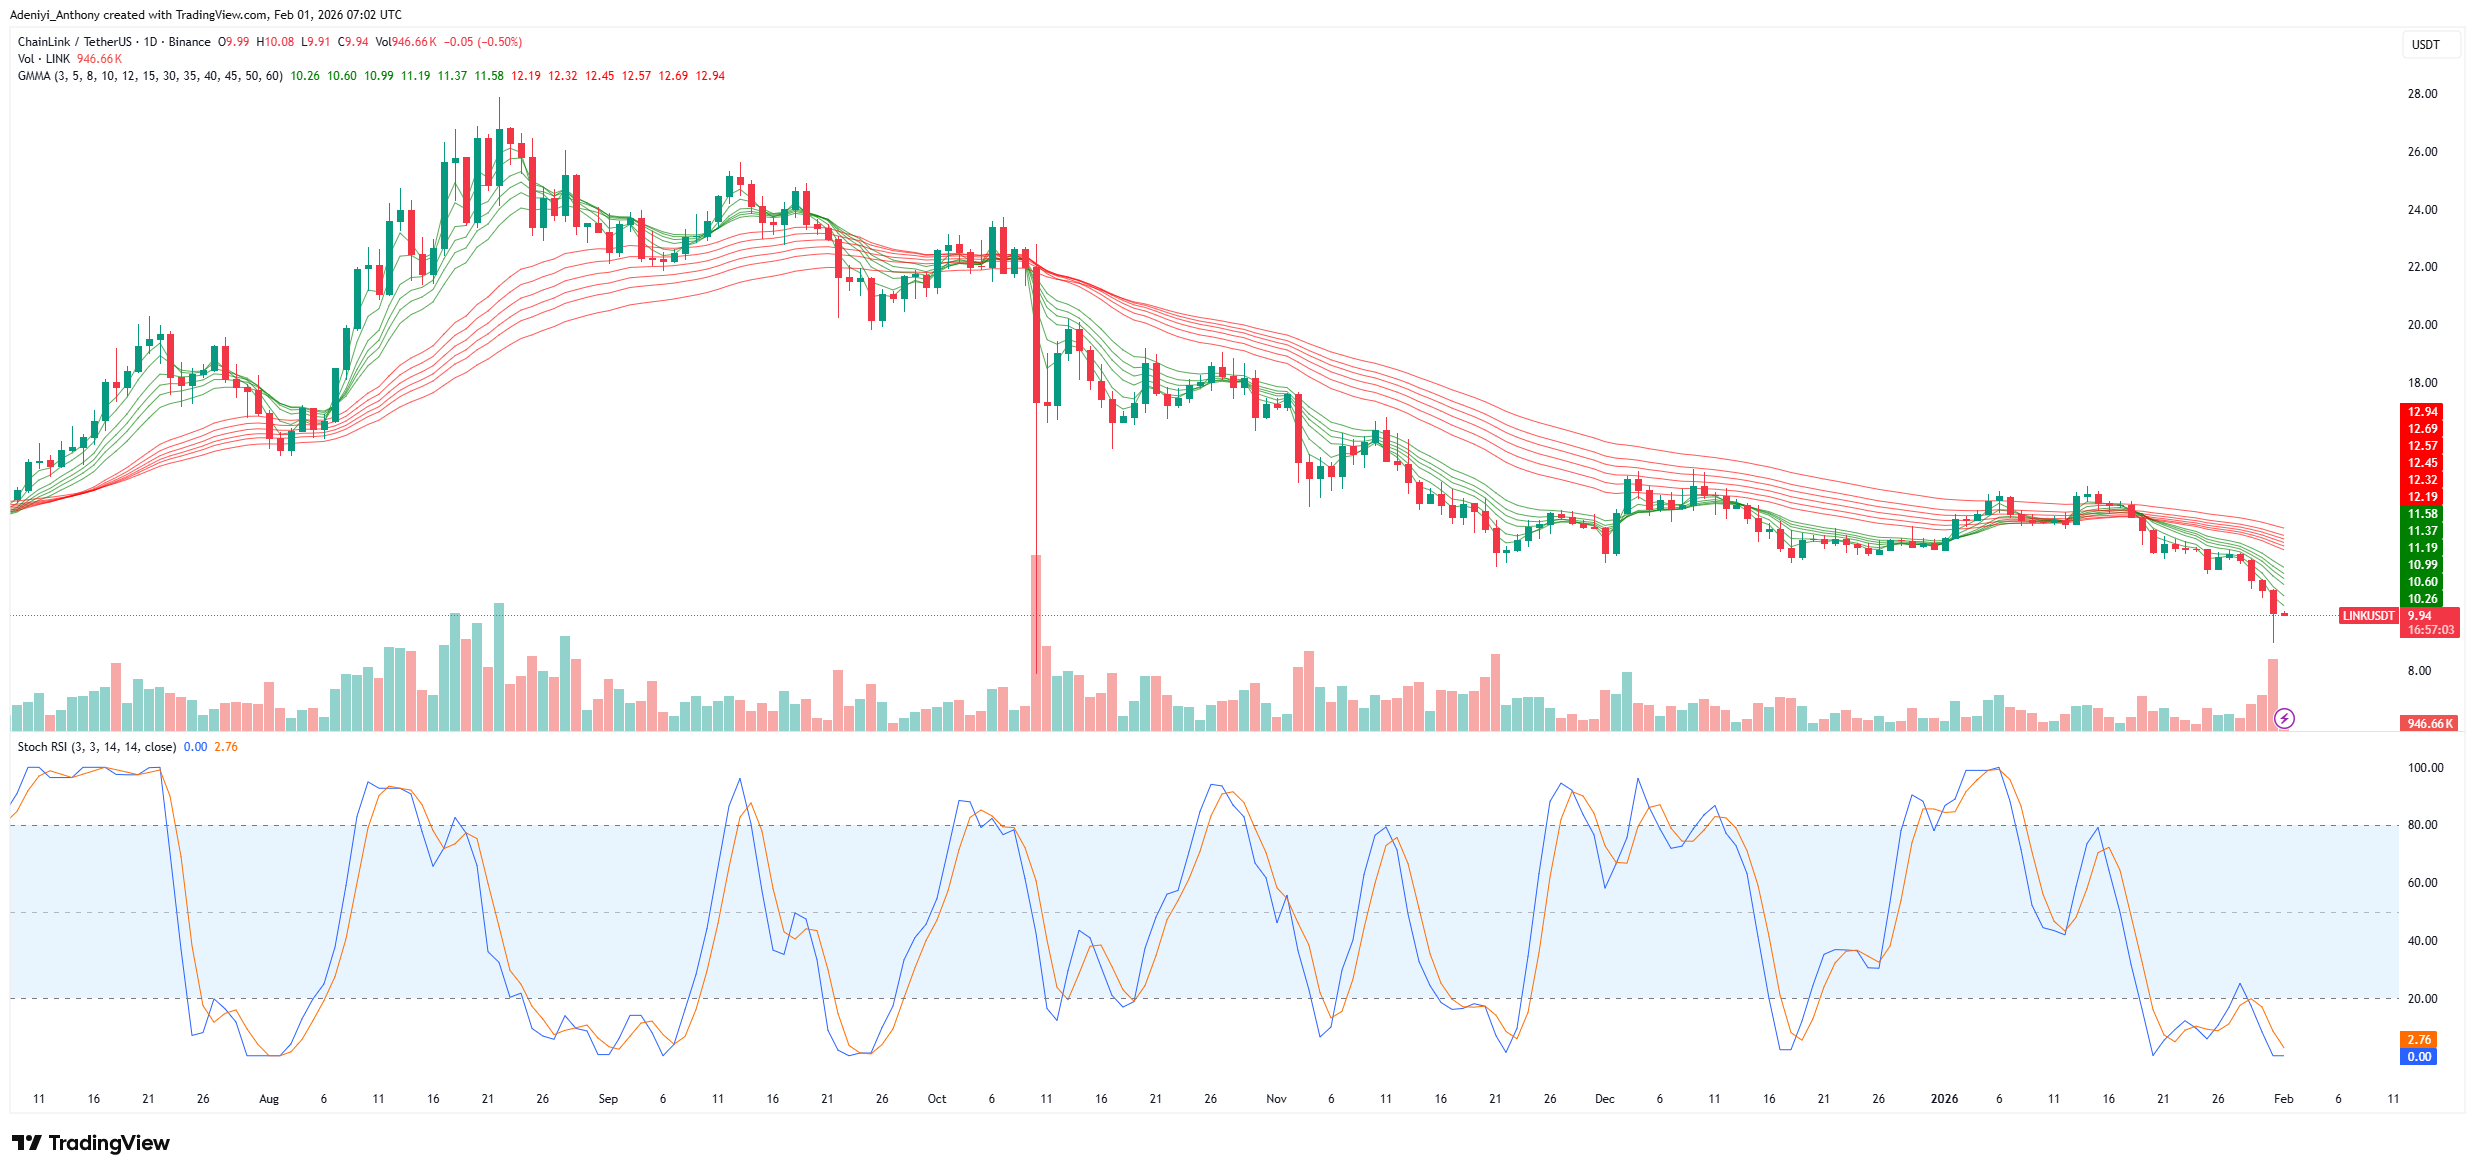
Technically, the Chainlink price on the daily timeframe appears to be displaying a falling trend channel. The price action shows that Chainlink against Tether has failed to hold above the $10 psychological level, as seen with the bearish crossover of the Guppy Multiple Moving Averages (GMMA).
From another angle, the Stochastic RSI displays an oversold condition, operating at the extreme selling level. However, the current direction of the blue line suggests momentum may be tilting, and a bounce to the north may be seen. Meanwhile, without a push past $11.58, the sell pressure remains strong.
Chainlink’s Current Wave Structure
Recently, the Chainlink price has hit a significant support level at $8.90. This is coinciding with a broader crypto market sell-off. Though current patterns suggest a complex downward correction, it is believed that this support level could be the starting point of a potential upside. However, the price needs to successfully break above $11.20 and $14.50 to signal that the long-term slump is over.
As it stands, the expectation of a five-wave upward movement to confirm a trend reversal is high, despite the current downtrend. To this end, further minor dips are possible, but the focus remains on clearing key resistance levels to prove that the recent selling pressure is exhausted.
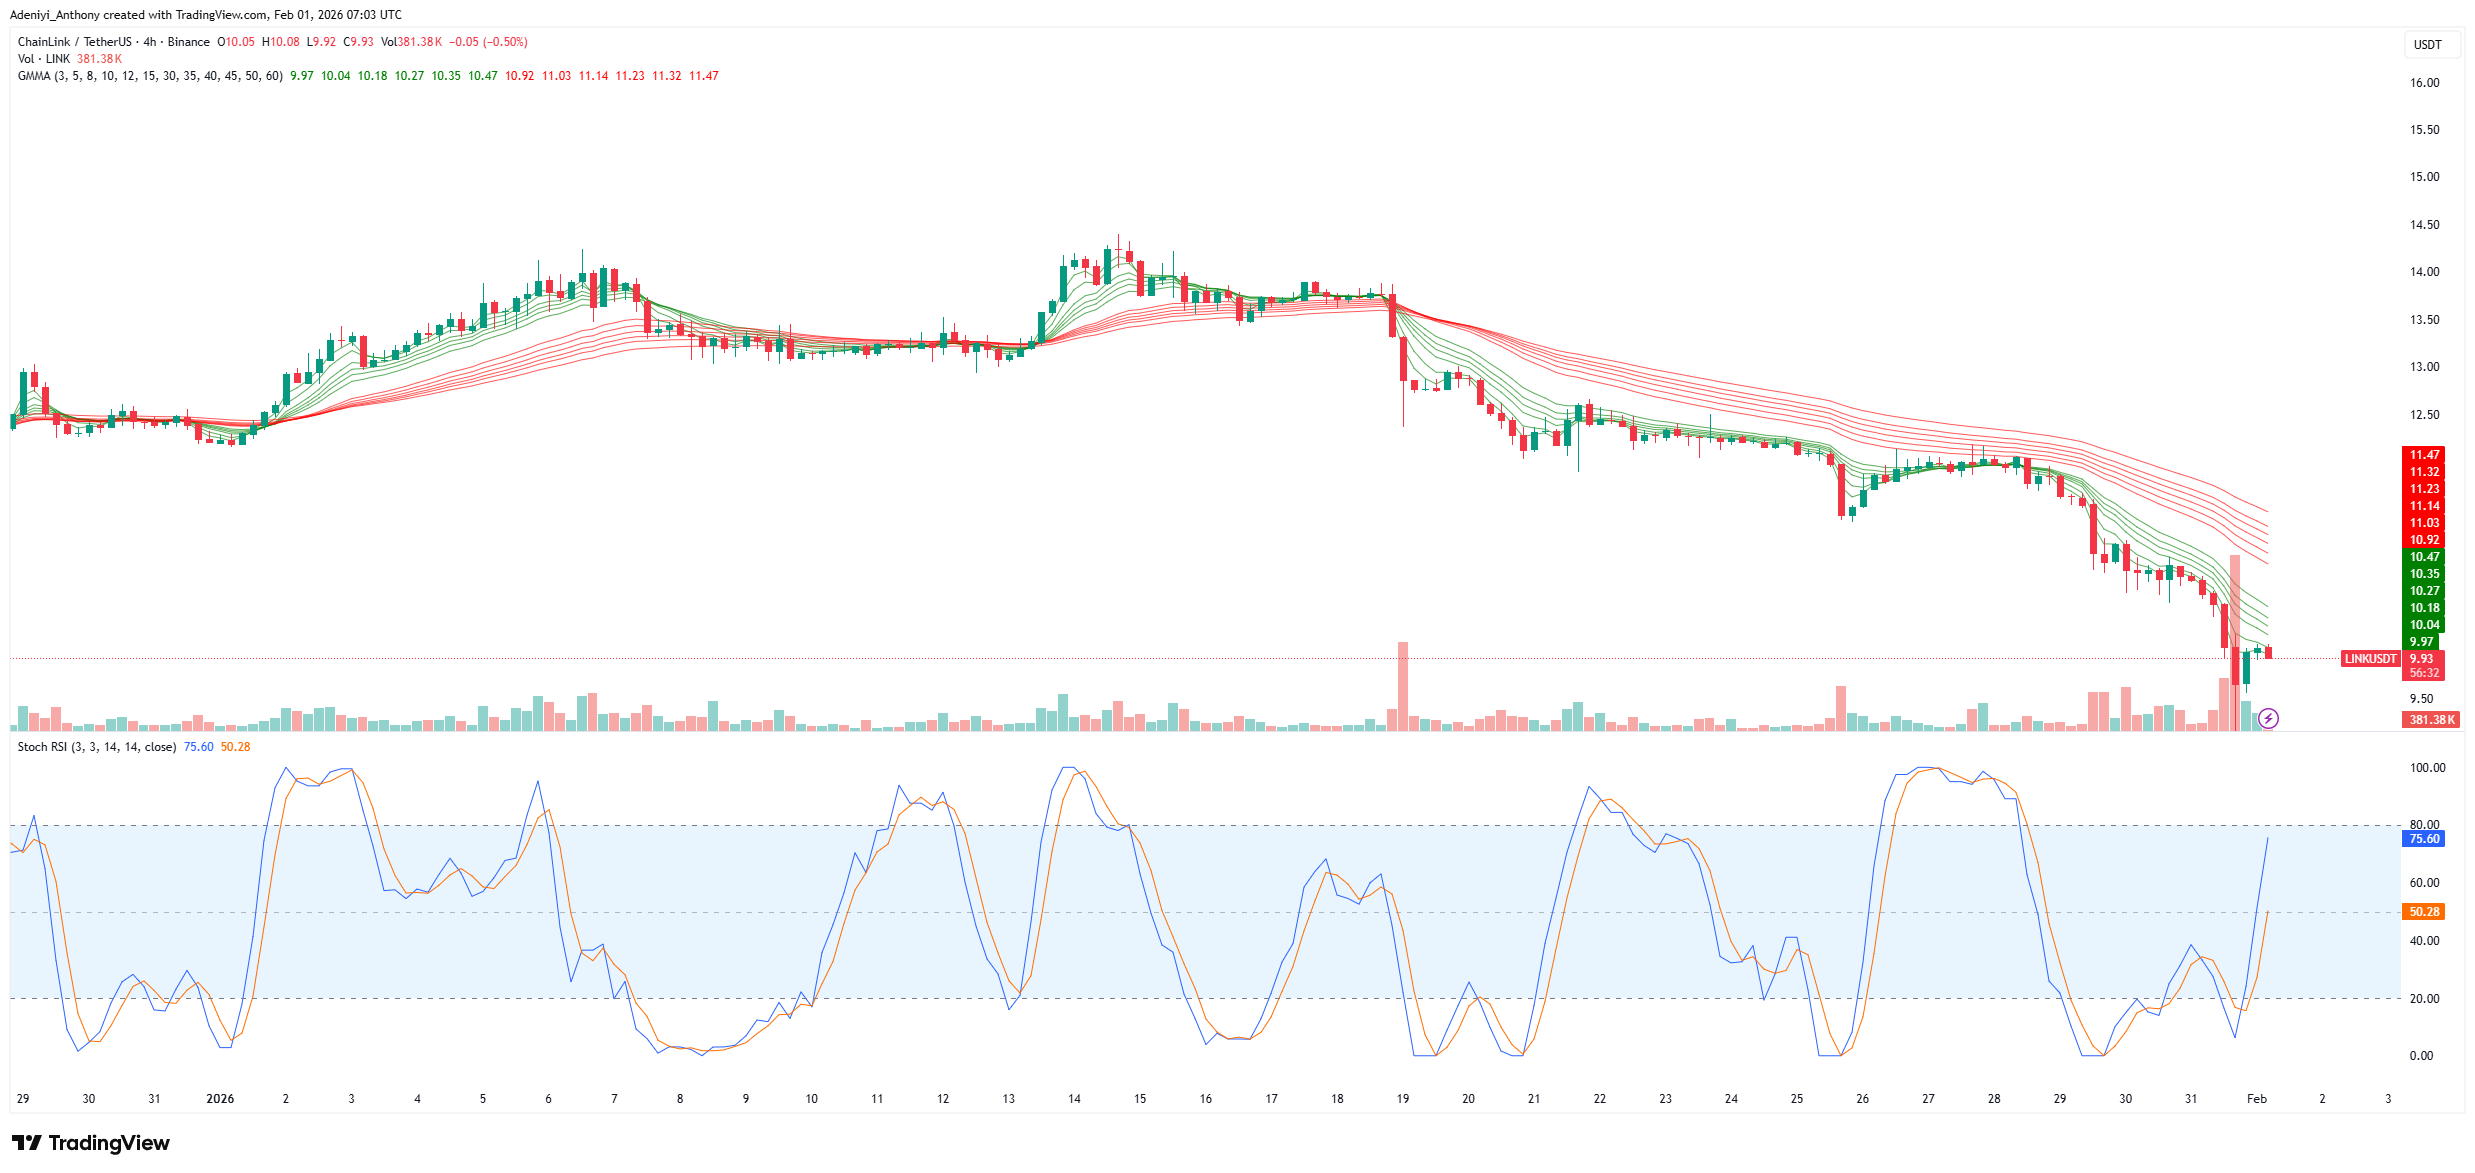
LINK/USDT Analysis: Can Chainlink Price Reclaim the $10.47 Level?
The 4-hour chart of LINK/USDT seems to be projecting the broader charts. However, it appears the bulls are forcing themselves back into the market. Meanwhile, the recent downward trend seems to be sudden after a prolonged sideways move. The GMMA still maintains the previous structure despite the signal from the SRSI.
To this end, without a sustained hold above $11.47 in the coming session, the token may choose to consolidate between the $9.00 and $11.00 levels.
You can purchase crypto coins here. Buy Crypto