Chainlink Price Eyes Recovery Amidst Lower Timeframe Oversold Conditions
Estimated Reading Time: 3 minutes
Don’t invest unless you’re prepared to lose all the money you invest. This is a high-risk investment and you are unlikely to be protected if something goes wrong. Take 2 minutes to learn more

The Chainlink price fell 1.07% in the past 24 hours, mirroring the crypto market’s 0.92% drop. This pullback shows a cautious, risk-off mood as regulatory uncertainty and a stalled recovery weigh on altcoins.
Chainlink against Tether is testing a multi-year support zone. Pressure is adding up in this region. Meanwhile, the Chainlink price remains between $11.89 and $14.64. Market conditions show Chainlink price can break either direction.
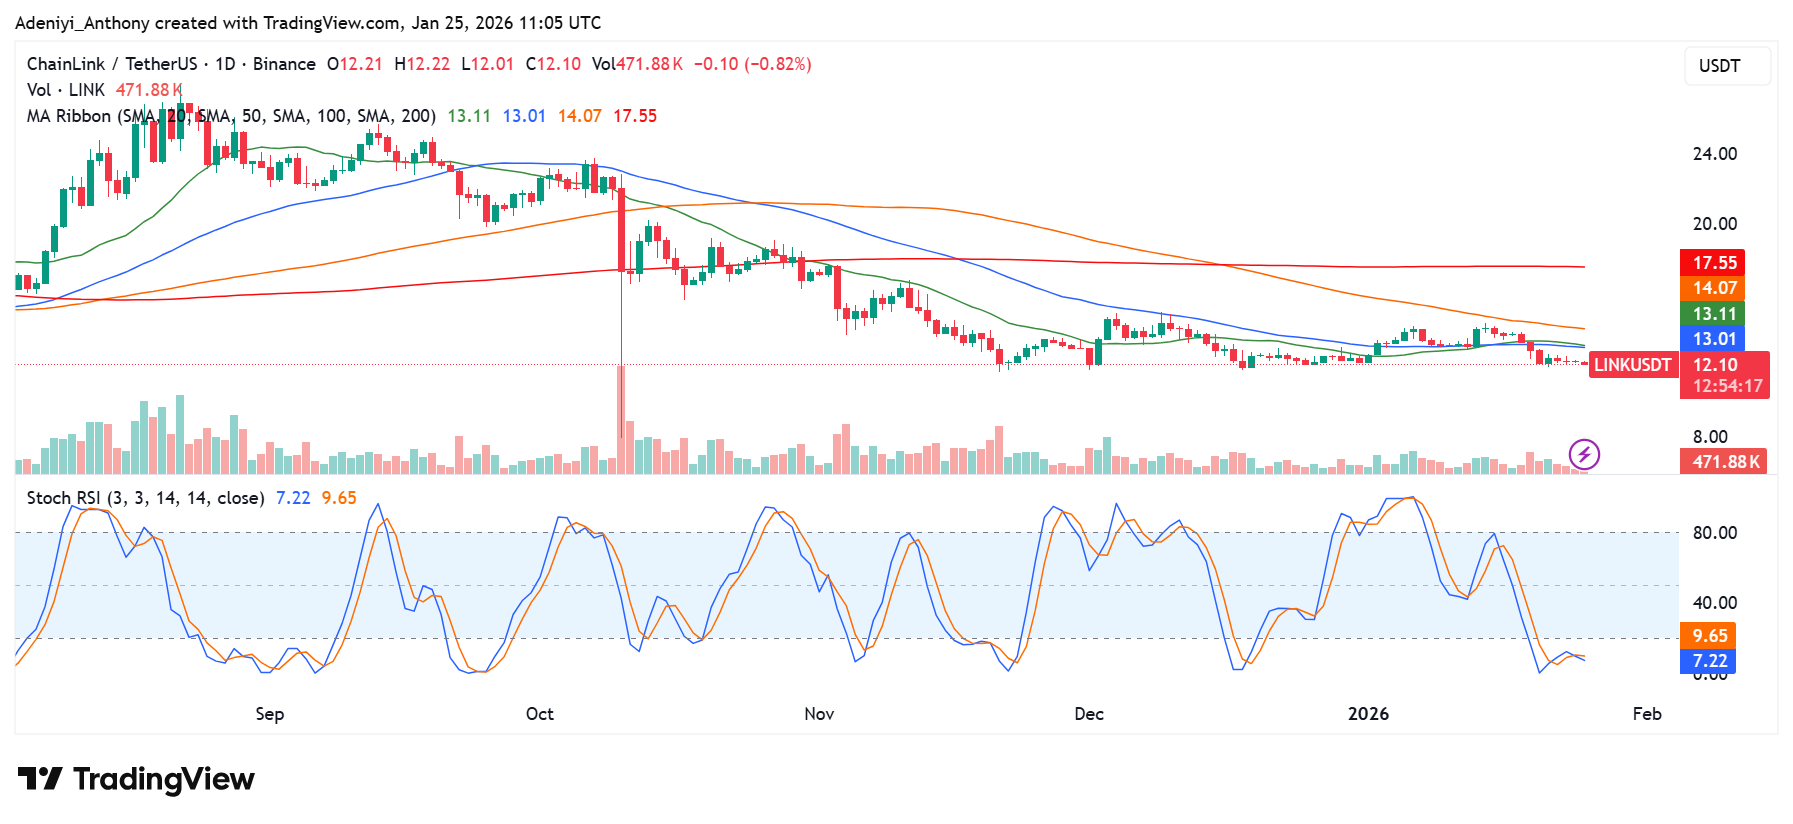
Currently, Chainlink trades at $12.10 with over 471,000 traded volumes on the daily chart.
Technical Indicators
Major Resistance Levels: $12.83, $14.50, and $14.68
Major Support Levels: $12.00, $11.20, and $10.00
Technical Analysis
On the daily chart, Chainlink price is currently in a cooling phase, with the 20- and 50-period moving averages on this timeframe sloping downward, acting as a dynamic resistance near the $12.50 mark. Observably, the Stochastic has dropped to 7.22, which typically suggests an increasing bearish signal.
To this end, as long as the price holds above the $12.00 support level, the intraday outlook remains a buy-the-dip scenario for scalpers eyeing a return to $13.50.
Chainlink Price: A Look at the Wave Structure
Chainlink price has been identified to be operating around a critical structural support zone between $11.50 and $12.00. Although the expectation of a wave E relief bounce around $13.40-$13.50 using Fibonacci extensions to define these targets is high. However, the current three-wave price action suggests the market remains in a corrective phase rather than a confirmed bullish reversal.
Meanwhile, an expectation of a decisive break above $12.65 is necessary to validate a short-term rally. However, the Chainlink price still maintains a skeptical bias toward lower prices until a clear five-wave advance emerges.
LINK/USDT Analysis: Price Action Suggests Potential Breakout
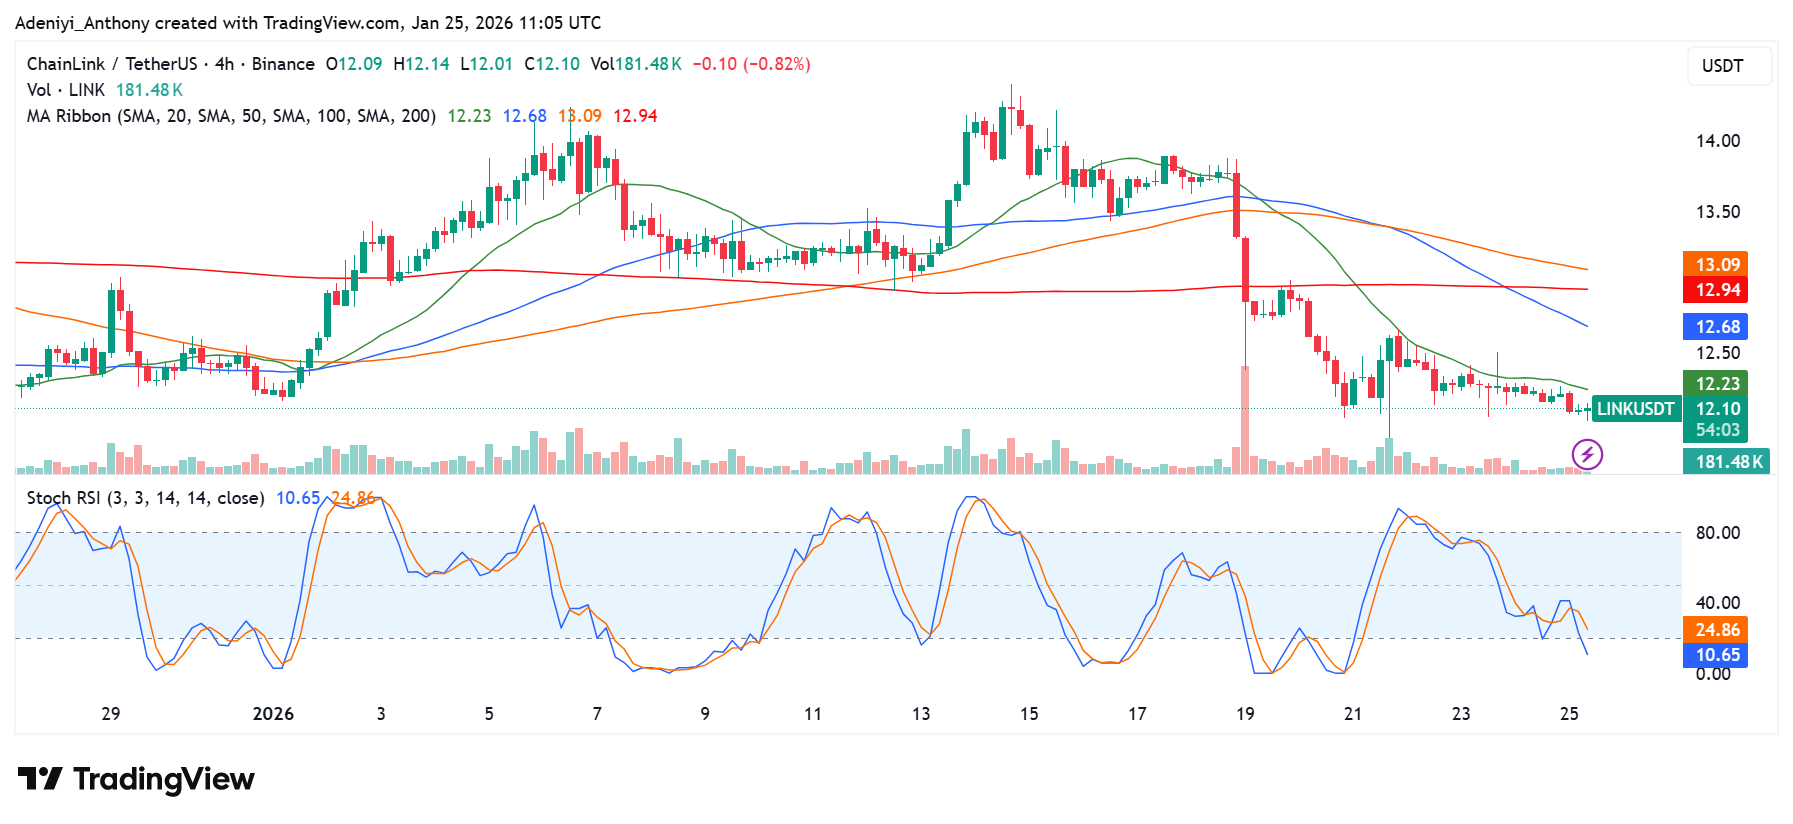
Technically, it has been revealed that LINK/USDT on the 4-hour chart is exhibiting a neutral-to-slightly bearish stance on the daily timeframe. Additionally, it was observed that the Chainlink price is currently trading below its 20, 50, 100, and 200-day simple moving averages, which indicates a weakening long-term trend. However, SRSI appears to be improving in the earlier trade before sitting at 0.00, suggesting increasing sell pressure as the market awaits a bounce in the coming session.
To this end, while the current volume exceeds 181,000, it was concluded that a decisive close below $12.06 may be noticed. However, it appears that a strong demand may be developing at this level, and a break above $12.84 is needed to confirm a trend turnaround.
You can purchase crypto coins here. Buy Crypto