Wall Street Memes (WSM/USD) Price Drives On, Igniting Pressure
Estimated Reading Time: 3 minutes
Don’t invest unless you’re prepared to lose all the money you invest. This is a high-risk investment and you are unlikely to be protected if something goes wrong. Take 2 minutes to learn more
Wall Street Memes Price Prediction – July 9
As it is depicted on the trade chart technically, a move slightly to the downside has taken place to allow long-term position movers to build back up from a given lower axis, as the WSM/USD market drives on, igniting pressure.
Buying WSM/USD market activity has consistently emerged near the lower Bollinger Band, suggesting accumulation interest at discounted levels and weakening bearish momentum around the $0.0005 support zone. A gradual uptick in the oscillating tools indicates a potential shift toward bullish pressure as sellers lose conviction near critical demand levels.
WSM/USD Market
Key Levels
Resistance levels: $0.0007, $0.0008, $0.0009
Support levels: $0.0005, $0.0004, $0.0003
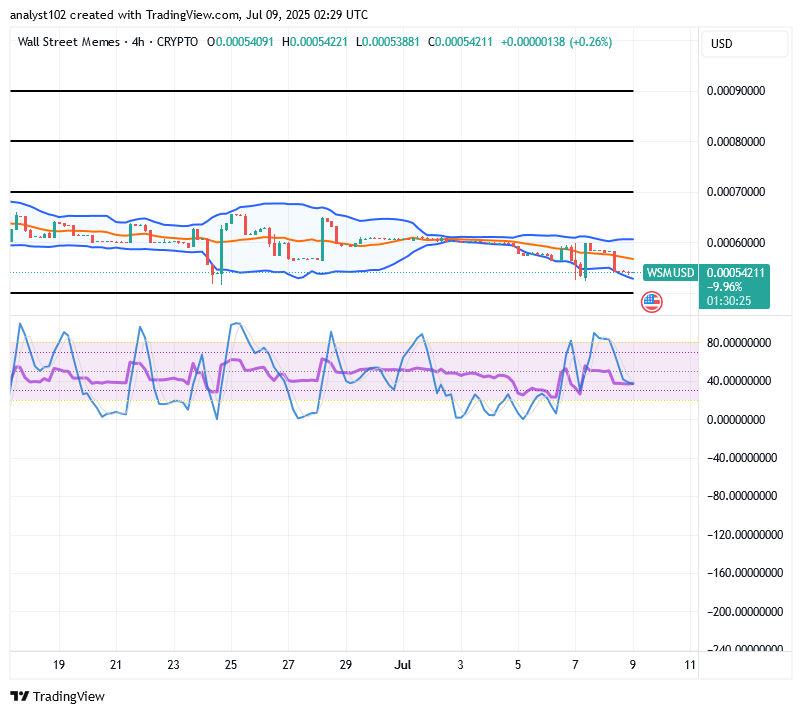
WSM/USD – 4-Hour Chart
The WSM/USD 4-hour chart reveals that the crypto-economic market drives on steadily, igniting pressure in its outputs.
The Bollinger Bands steadily stretched briefly to the south side to technically provide for most decent potential longing situations in the proceedings. The stochastic oscillators are positioned around the point of 80, instituting a mere southbound-curving shape to cause a precautionary signal against getting quick moves away from the present market zones.
Is It Technically Advisable for WSM/USD Buyers to Hold Positions While Price Action Remains Low?
Different pricing movements have continued to feature in the operations of WSM/USD to support ideal longing entries, as the price drives on, igniting pressure.
The current market behavior of WSM/USD reflects a moderately optimistic technical landscape, with price action stabilizing near the \$0.0006 level—a zone attracting noticeable interest from bargain hunters and mid-term accumulators. Momentum indicators are showing early signs of shifting toward bullish territory, while bearish pressure appears to be waning. The contracting volatility band and the subtle upward tilt in directional bias point to a potential bullish setup, though confirmation remains tentative. With roughly balanced sentiment leaning slightly in favor of the bulls, traders should approach short positions with caution as upward traction begins to build.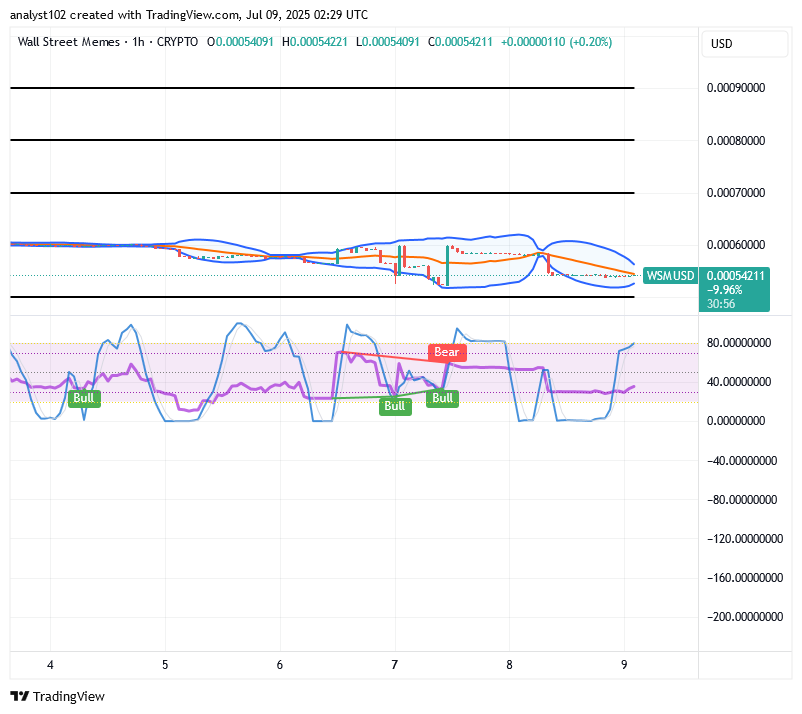
WSM/USD 1-Hour Chart
The 1-hour chart, as of the time of this analysis, showcases that the WSM/USD trade drives on stably, igniting pressure in the setup.
The Bollinger Bands have, in the meantime, continued to realign gradually in the mood of paving the way for decent momentum-gathering proceeds in the market’s transitional phase. The stochastic oscillators have been consistently swerving about through variant points, indicating increased sensitivity to price fluctuations and signifying the probable event that could lead to the market gaining directional muscles positively.
$WSM / \$USDT is now officially tradeable on #Bybit Perpetuals with high liquidity access.
$WSM community, we saw your Tweets! 👏$WSM / $USDT is now tradeable on #Bybit Perpetuals.
— Bybit (@Bybit_Official) October 13, 2023
Trade here: https://t.co/le4XyVyXaZ
Also want your project listed? Share your suggestions here:https://t.co/W7EWJVVNV5 https://t.co/XgXoL7g0rF