Wall Street Memes (WSM/USD) Trade Is Onward, Showing Power
Estimated Reading Time: 3 minutes
Don’t invest unless you’re prepared to lose all the money you invest. This is a high-risk investment and you are unlikely to be protected if something goes wrong. Take 2 minutes to learn more
Wall Street Memes Price Prediction – July 8
A slight repositioning trade order has been relatively showcased in the way that the WSM market long-term position pushers have been dealing with the market strength of the American dollar, as the crypto-economic situation is onward, showing power.
Given the prevailing range-bound structure characterizing the WSM/USD pair, where price action oscillates within a defined horizontal channel, a minor inflection in momentum from the lower boundary of the range is technically positioned to trigger a more sustained upward leg. This setup reflects a potential bullish divergence, often associated with accumulation phases, and increases the probability of a near-term directional shift favoring the upside.
WSM/USD Market
Key Levels
Resistance levels: $0.0007, $0.0008, $0.0009
Support levels: $0.0005, $0.0004, $0.0003
WSM/USD – 4-Hour Chart
The WSM/USD 4-hour chart showcases that the base trading instrument is onward at a given lower side, showing power in its indexes arrangement.
The stochastic oscillators are positioned around the point of 80, instituting a mere southbound-curving shape to cause a precautionary signal against getting quick moves away from the present market zones. The Bollinger Bands steadily stretched briefly to the south side to technically provide for most decent potential longing situations in the proceedings. 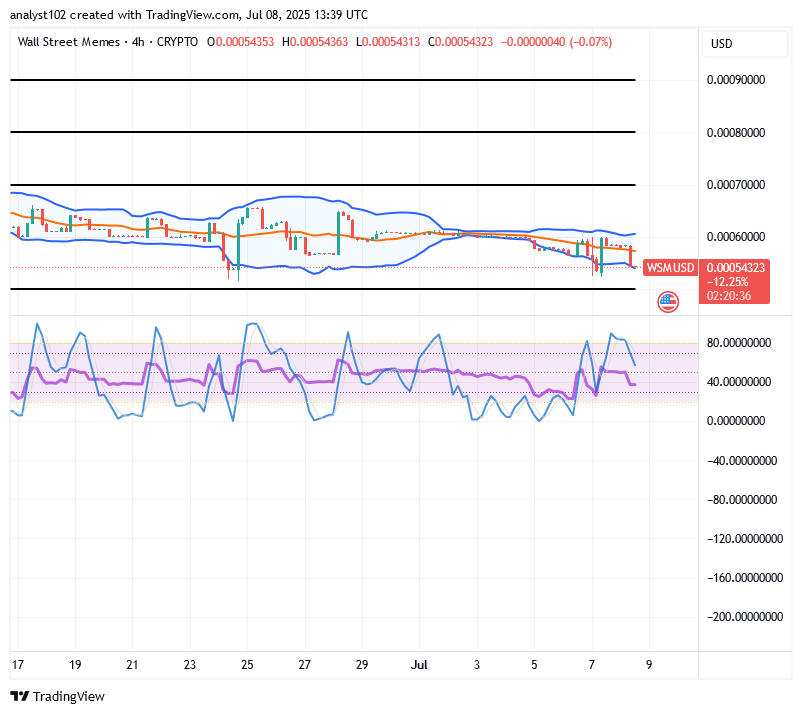
Might $0.0006 Not Act as a Key Level for WSM/USD Traders to Strategize Breakout?
Market lines situated around $0.0006 are tenable among the important spots for the WSM/USD traders to strategize breakouts, given that the price is onward, showing power in its moving styles.
Market dynamics surrounding WSM/USD are signaling a constructive technical transition, as price activity steadies around the \$0.0006 threshold—a level reflecting increased buying interest and positioning by value-seeking participants. Momentum indicators are gradually tilting in favor of buyers, with downward forces showing signs of exhaustion. The narrowing volatility band, coupled with an improving directional bias, suggests an emerging bullish framework that could catalyze a breakout to the upside in the sessions ahead. Traders are advised to remain cautious against aligning with shorting moves, given bullish undercurrents.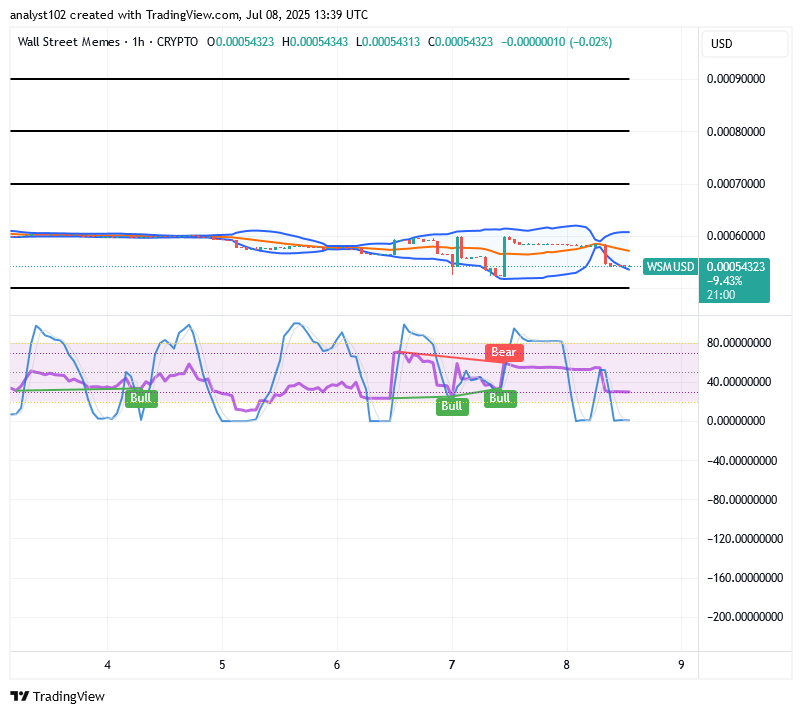
WSM/USD 1-Hour Chart
The 1-hour chart, as of the time of this piece, mirrors that the WSM/USD trade is onward at a given lower side, showing power in its index arrangement.
The Bollinger Bands have momentarily expanded downward, creating potential strategic long-entry zones near the lower band threshold, indicating suppressed volatility and latent bullish pressure. Meanwhile, the stochastic oscillators are aligning in a convergence setup that weakens the probability of establishing viable short positions, as oversold conditions persist.
BIGTIMEUSDT & WSMUSDT Perpetual Contracts Now Live on Bybit!
🚀 BIGTIMEUSDT & WSMUSDT Contracts now on Bybit!
— Bybit (@Bybit_Official) October 12, 2023
Dive into new trading opportunities with 1-25x leverage. Plus, they’re now on Bybit Futures Grid Bot! Start trading now.
📈 BIGTIME: https://t.co/FAQlbhnzAh
📈 WSM: https://t.co/pb2y2AfMBE#CryptoTrading #Bybit