Wall Street Memes (WSM/USD) Trade Bounces, Flexing Muscle
Estimated Reading Time: 3 minutes
Don’t invest unless you’re prepared to lose all the money you invest. This is a high-risk investment and you are unlikely to be protected if something goes wrong. Take 2 minutes to learn more

Wall Street Memes Price Prediction – July 7
It is observed that the Wall Street Memes coin market buyers are readily preparing for securing more points against the US currency, as the economic situation of the base instrument bounces about, flexing muscle.
It is more or less resembling a free-flowing price movement in the business activities of WSM/USD market, with the indicators slightly tilting to the downside—intentionally allowing long-term position traders to secure additional entry zones at reasonably discounted values, ahead of the long-anticipated and potentially massive upward bounce-offs.
WSM/USD Market
Key Levels
Resistance levels: $0.0007, $0.0008, $0.0009
Support levels: $0.0005, $0.0004, $0.0003
WSM/USD – 4-Hour Chart
The WSM/USD 4-hour chart reveals that the former instrument bounces about, flexing muscle at a slightly reduced trade spot of the indicators.
The Bollinger Bands steadily stretched briefly to the south side to technically provide for most decent potential longing situations in the proceedings. The stochastic oscillators are positioned around the point of 80, instituting a mere southbound-curving shape to cause a precautionary signal against getting quick moves away from the present market zones.
Could $0.0006 Emerge as a Key Decision Point for WSM/USD Traders?
Following a short notable move in the negative direction, it is now evident that the $0.0006 is serving as a key trade line for WSM/USD market partakers, as the current business stance shows that the price bounces about, flexing muscle in its index setup.
WSM/USD appears to be undergoing a favorable shift in sentiment, with price action consolidating steadily near the $0.0006 region—a zone indicative of growing accumulation interest. Technical strength metrics increasingly favor bullish momentum, as selling pressure continues to wane. The tightening range and gradually strengthening market tone point to a developing bullish structure, setting the stage for a potential upward breakout in the near term. 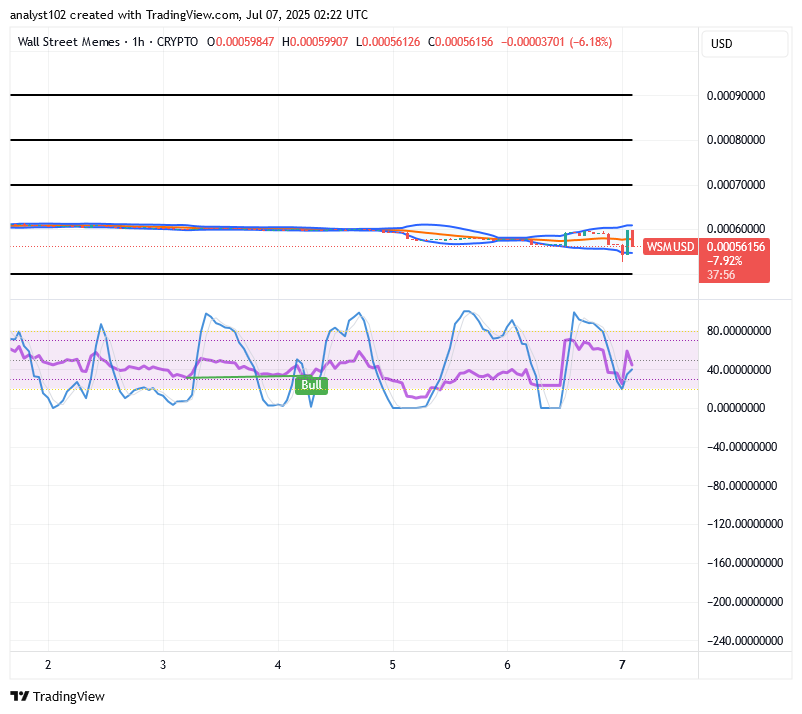
WSM/USD 1-Hour Chart
The 1-hour chart, as of the technicality of this write-up, showcases that the WSM/USD trade bounces around $0.0006 slightly to the decrease side, flexing muscle.
In the interim, the stochastic oscillators have maintained a consistent wave-like motion of advances and retracements, reflecting a progressive accumulation of bullish momentum and the subtle shaping of an upward directional tendency. At the same time, the Bollinger Bands have momentarily narrowed with a slight downward tilt, offering a favorable window for well-timed long positions near the lower boundary of the volatility range.
$WSM community, we saw your Tweets — bullish, supportive, momentum-driven, and technically sound!
$WSM community, we saw your Tweets! 👏$WSM / $USDT is now tradeable on #Bybit Perpetuals.
— Bybit (@Bybit_Official) October 13, 2023
Trade here: https://t.co/le4XyVyXaZ
Also want your project listed? Share your suggestions here:https://t.co/W7EWJVVNV5 https://t.co/XgXoL7g0rF