Wall Street Memes (WSM/USD) Trade Pushes, Flexing Bullishly
Estimated Reading Time: 3 minutes
Don’t invest unless you’re prepared to lose all the money you invest. This is a high-risk investment and you are unlikely to be protected if something goes wrong. Take 2 minutes to learn more
Wall Street Memes Price Prediction – July 6
Accumulation footprints are becoming more evident, with upward pivot formations gradually building momentum in the market’s stances of Wall Street Memes coin paired with the valuation of the US currency, given that the crypto-economic trade pushes through, flexing bullish might.
The current WSM/USD market structure indicates that buyers are actively reinforcing demand around localized support zones, potentially establishing a foundation for a strong bullish reversal and an extended breakout sequence. Consequently, any short-term retracements or attempts to push the base instrument lower may serve as liquidity traps, offering strategic entry points for accumulation and renewed upward momentum.
WSM/USD Market
Key Levels
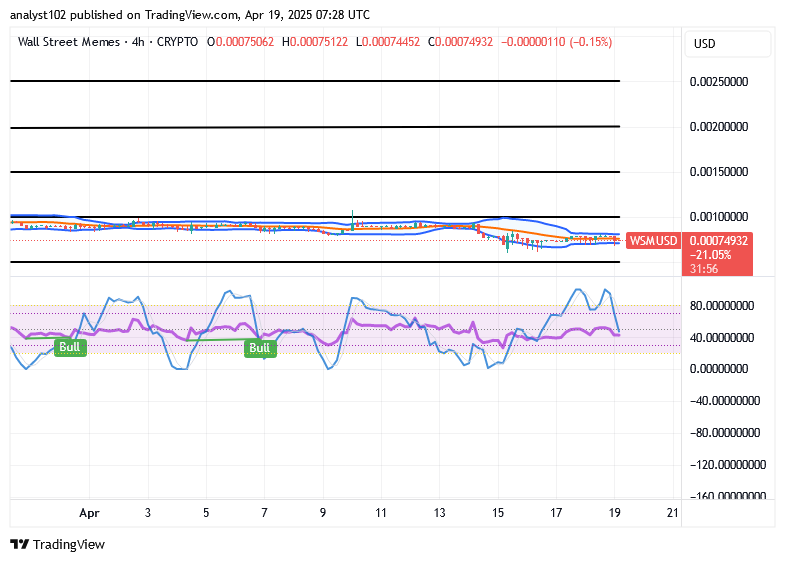
Resistance levels: $0.0007, $0.0008, $0.0009
Support levels: $0.0005, $0.0004, $0.0003
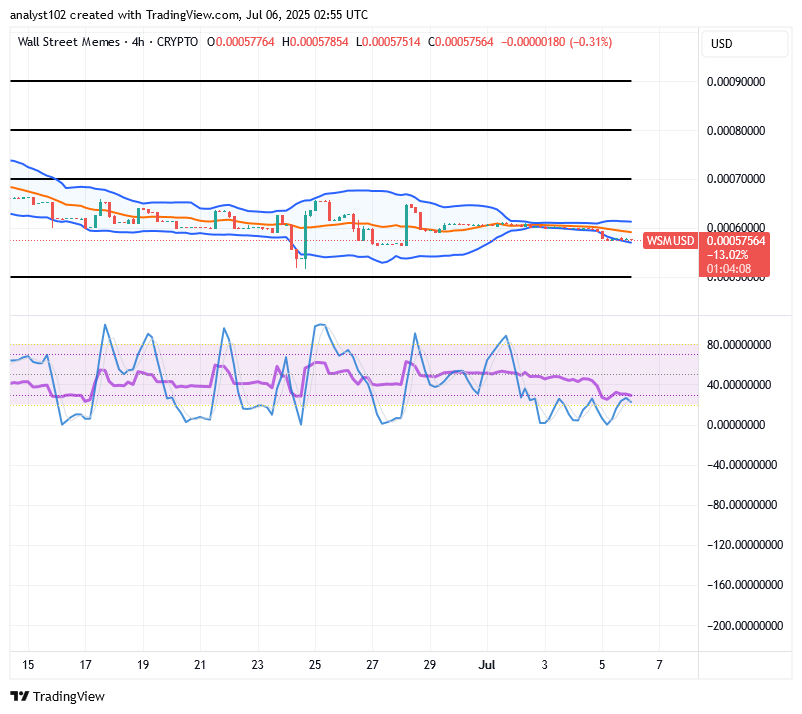
WSM/USD – 4-Hour Chart
The WSM/USD 4-hour chart showcases that the crypto-economic price currently pushes through some sizeable lighter spots, flexing bullish might.
The stochastic oscillators continue to hover in optimistic territory, reflecting persistent upward momentum and affirming the strength of the prevailing bullish framework. Simultaneously, the Bollinger Bands are mapping critical value zones where intensified accumulation is anticipated, enhancing the probability of constructive entry points amid a well-balanced volatility environment.
Is WSM/USD Gearing Up for a Directional Shift Around the $0.0006 Benchmark?
Noticeably, there has been a lighter move in the way that the WSM/USD market showcasing that purchasers have continually gearing up around the trade line of $0.0006, given that the crypto-economic trade pushes, flexing bullish might.
WSM/USD is showing signs of a bullish transition as price steadies around the $0.0006 level, highlighting an active accumulation zone. Strength indicators are leaning toward buyer control, with fading bearish pressure. The narrowing price range and improving sentiment suggest rising upside potential, paving the way for a constructive breakout ahead.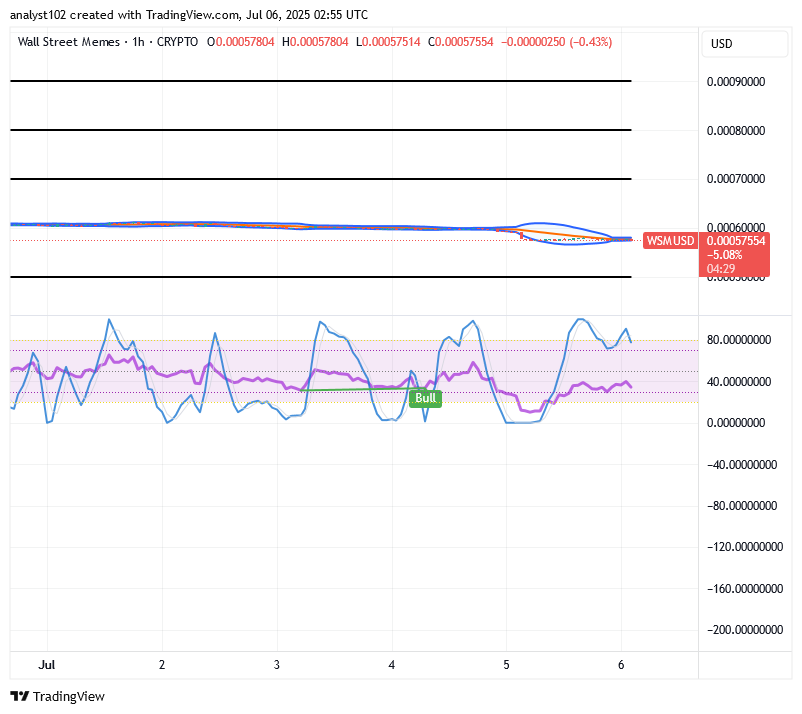
WSM/USD 1-Hour Chart
The 1-hour chart, as of this technical piece, shows that the WSM/USD market pushes through, flexing bullish might.
The Bollinger Bands continue to exhibit a narrow and horizontal formation around the $0.0006 region, suggesting a period of limited price dispersion and constrained market activity. This prolonged tightening phase reflects underlying market tension, often acting as a precursor to an imminent breakout move. Meanwhile, the stochastic oscillators have maintained a cyclical pattern of advances and pullbacks, indicating a steady build-up in bullish energy and the gradual formation of an upward directional bias.
$WSM / $USDT is now officially tradeable on #Bybit Perpetuals Market.
$WSM community, we saw your Tweets! 👏$WSM / $USDT is now tradeable on #Bybit Perpetuals.
— Bybit (@Bybit_Official) October 13, 2023
Trade here: https://t.co/le4XyVyXaZ
Also want your project listed? Share your suggestions here:https://t.co/W7EWJVVNV5 https://t.co/XgXoL7g0rF