Wall Street Memes (WSM/USD) Price Rallies, Testing Toughness
Estimated Reading Time: 4 minutes
Don’t invest unless you’re prepared to lose all the money you invest. This is a high-risk investment and you are unlikely to be protected if something goes wrong. Take 2 minutes to learn more
Wall Street Memes Price Prediction – July 3
It is yet being felt that the impacts that bulls have persistently been inputting against bears in the market operations that paired Wall Street Memes coin with the valuation of the US dollar are being steadily composed at a reasonable lower trade point, as the crypto-economic price rallies, testing toughness around $0.0006.
On a daily basis, there is increasing technical confirmation that long-term WSM/USD market participants are strategically intensifying accumulation activity across foundational trading pairs in anticipation of potentially sharp and unanticipated bullish reversals. This positioning behavior is particularly evident amid narrowing volatility zones, as reflected by price actions gravitating near the lower Bollinger Band boundaries. Consequently, short sellers are advised to exercise heightened caution, as entry decisions made within this contraction phase may be vulnerable to abrupt whipsaws or false breakdowns, especially if bullish momentum is reignited without warning.
WSM/USD Market
Key Levels
Resistance levels: $0.0007, $0.0008, $0.0009
Support levels: $0.0005, $0.0004, $0.0003
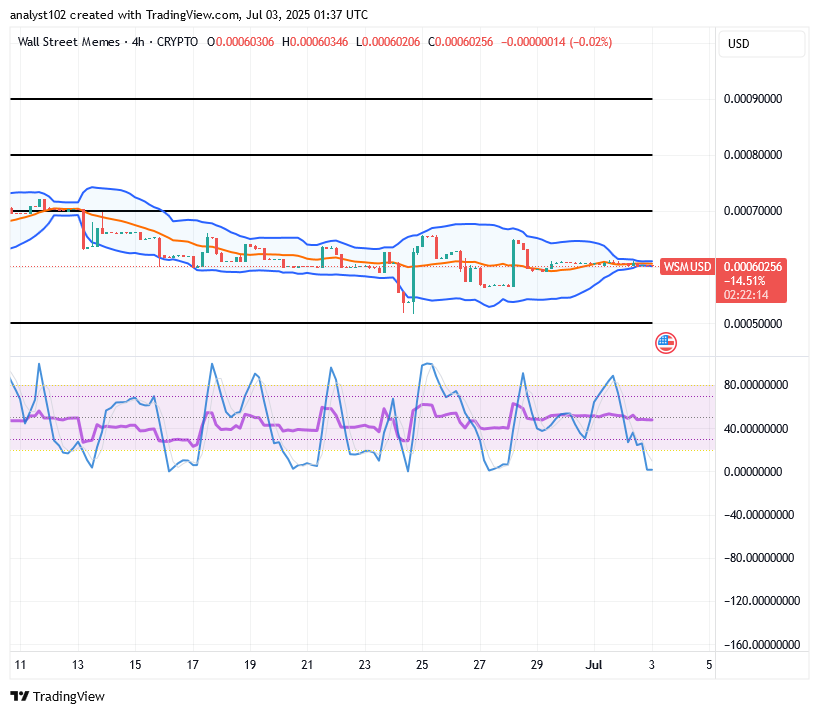
WSM/USD – 4-Hour Chart
The WSM/USD 4-hour chart reveals that the crypto-economic price presently rallies at a reduced spot slightly to the upside, testing toughness at a higher axis built around $0.0006.
The stochastic oscillators are consistently navigating within a constructive bandwidth, reflecting ongoing upward momentum attempts amid a structurally resilient market tone. Simultaneously, the Bollinger Bands are projecting critical value zones where intensified buyer engagement is expected to surface, reinforcing promising entry opportunities under well-tempered price fluctuations.
Will the $0.0006 Line Hold as a Pivotal Zone for WSM/USD Market Direction?
Believably, from the technical perspective, the $0.0006 line is tenable to hold as one of the pivotal trade zones for the market direction of WSM/USD, given that the current crypto-economic price rallies around the value line, testing toughness in the proceeds.
WSM/USD is exhibiting signs of upward re-calibration as price activity stabilizes around the $0.0006 level, suggesting a well-established consolidation base. Momentum is gradually tilting in favor of buyers, with decreasing downside friction indicating a transition toward sustained positive traction. The narrowing range reflects latent upside potential, as enhanced liquidity inflows and improving sentiment hint at an emerging rally structure. With foundational support zones gaining strength and broader participation likely accelerating, the stage appears set for an optimistic breakout trajectory.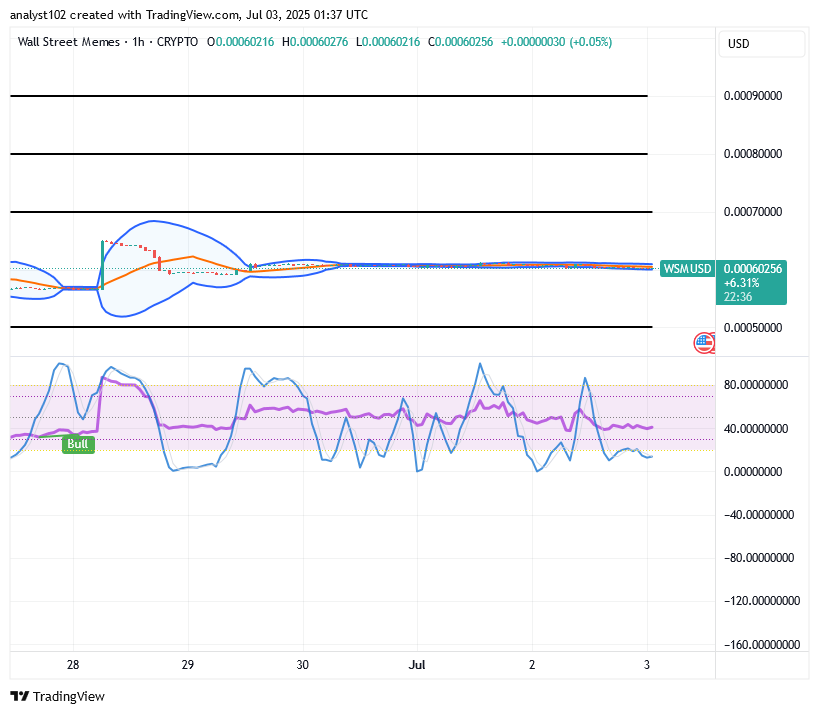
WSM/USD 1-Hour Chart
The 1-hour chart, as of this analytics ‘write-up, has it that the WSM/USD market’s trending price rallies more to the upside than the downside, testing toughness around $0.0006.
The Bollinger Bands remain narrowly compressed and horizontally anchored near the $0.0006 mark, reinforcing a low-volatility environment primed for a potential breakout. This steady consolidation underscores building price tension, often preceding explosive directional moves. Meanwhile, the stochastic oscillators have been actively cycling through both bullish and corrective waves, revealing strengthening momentum and an increasingly decisive bullish undertone.
BIGTIMEUSDT & WSMUSDT Futures Contracts are officially live now on Bybit!
🚀 BIGTIMEUSDT & WSMUSDT Contracts now on Bybit!
— Bybit (@Bybit_Official) October 12, 2023
Dive into new trading opportunities with 1-25x leverage. Plus, they’re now on Bybit Futures Grid Bot! Start trading now.
📈 BIGTIME: https://t.co/FAQlbhnzAh
📈 WSM: https://t.co/pb2y2AfMBE#CryptoTrading #Bybit