Fetch.ai (FET/USD) Witnesses Strong Rejection Below Key $0.6 Price Level in Recent Price Action
Don’t invest unless you’re prepared to lose all the money you invest. This is a high-risk investment and you are unlikely to be protected if something goes wrong. Take 2 minutes to learn more
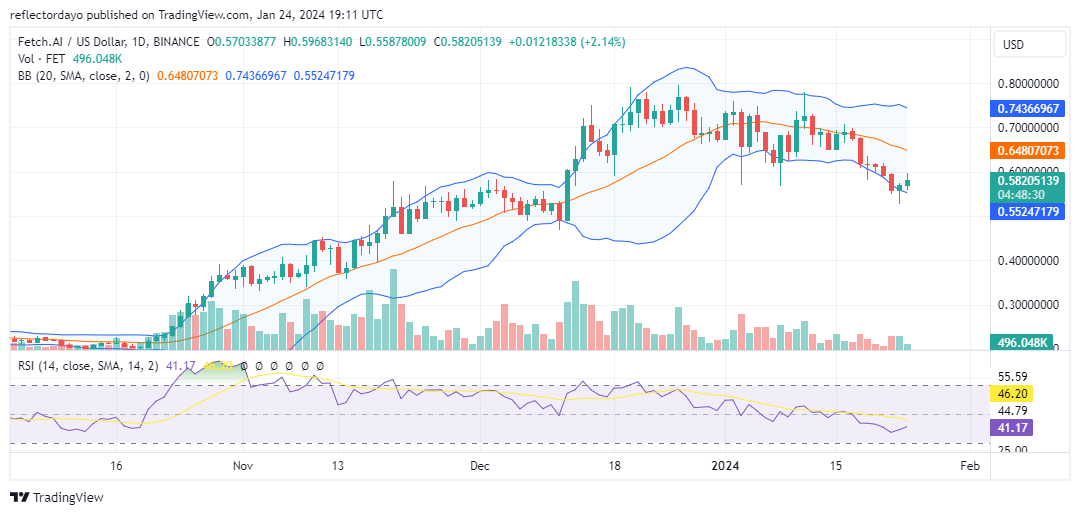
When the Fetch.ai market reached the $0.8 price level, a notable rejection of the bullish price occurred, leading bullish traders to reconvene at the $0.600 price level. This recent development, marked by the emergence of $0.800 as resistance and the $0.600 price level as support, signifies a consolidation phase observed between December 20 of the previous year and January 20 of the current year. The heightened market volatility is influencing a subtle shift towards a bearish trend. In the last three days, the market temporarily dipped below the $0.600 support level, prompting a swift and robust bullish response, ultimately rejecting the bearish price movement.
Fetch.ai Market Data
- FET/USD Price Now: $0.58
- FET/USD Market Cap: $486,531,416
- FET/USD Circulating Supply: 831,603,695 FET
- FET/USD Total Supply: 1,152,997,575 FET
- FET/USD CoinMarketCap Ranking: #109
Key Levels
- Resistance: $0.65, $0.70, and $0.75.
- Support: $0.55, $0.50, and $0.45.
The Fetch.ai: A Comprehensive Analysis of Crypto Signals and Indicators
Throughout the consolidation phase, the Fetch.ai market maintained considerable volatility, resulting in notable fluctuations during various trading sessions. The downtrend exhibited more pronounced swings than its upward counterpart. Consequently, the bear market has tested the key support level approximately 3 to 4 times, encountering rejection within the same session. This suggests that bearish traders may be exerting pressure for lower price levels, yet the repeated and immediate rejections may indicate a lack of strength to sustain the downward trend.
Investors should take note of this crypto signal, specifically the lower high formed at $0.77 on January 11 and another lower high at the $0.700 price level on January 16. These lower highs elucidate the reason for the brief break in the support level for three days.
Furthermore, the Relative Strength Index continues to measure momentum at the 41 level, highlighting the increasing bearish momentum in the market. This is further confirmed by the Bollinger Bands, which, although still indicating a high level of volatility, show a downward movement in the lower standard deviation curve and the 20-day moving average. The crypto signals from the indicators are pointing towards the development of bearish momentum.
FET/USD 4-Hour Chart Outlook
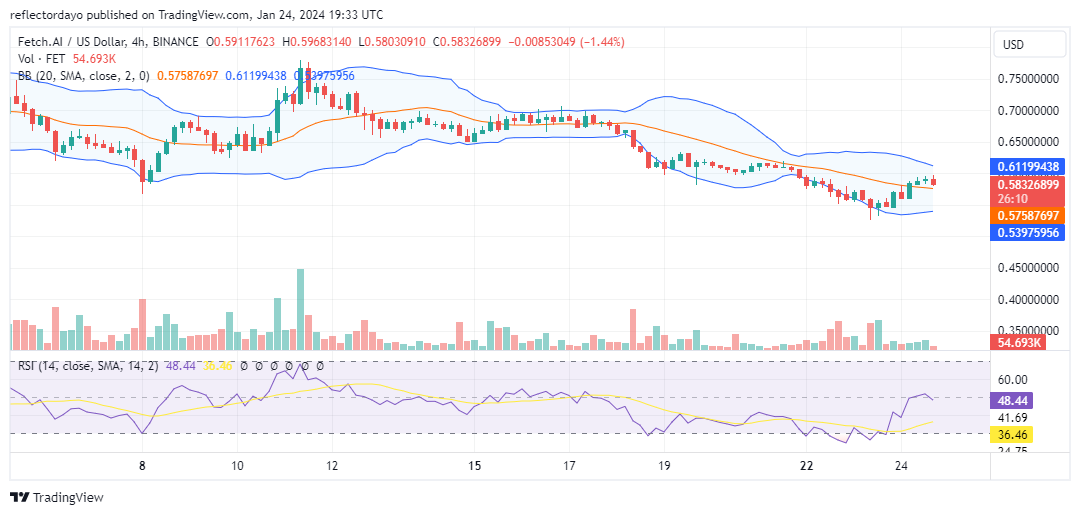
Examining the market through a shorter timeframe, specifically the 4-hour chart, reveals a downward tilt in the price channel, suggesting a potential continuation in the downward direction. It is observed that despite bullish attempts to drive the price higher, there is a struggle to reclaim levels above the $0.60 mark, which previously served as a significant market support level. Consequently, there is a likelihood that bullish forces may gather around the $0.55 price level in an effort to rally the price.
