Universal Market Access (UMA/USD) Bulls Strive to Uphold $5.538 as Key Support, Rescuing Bullish Momentum Amidst Robust Correction
Estimated Reading Time: 3 minutes
Don’t invest unless you’re prepared to lose all the money you invest. This is a high-risk investment and you are unlikely to be protected if something goes wrong. Take 2 minutes to learn more
Until recently, for the majority of the preceding year, Universal Market Access demonstrated a predominantly stagnant market performance. However, since May of the previous year, the market has undergone a substantial bullish shift, followed by a notable consolidation marked by a robust demand and supply equilibrium. Towards the conclusion of 2023, the market commenced a nuanced bullish progression, which further intensified by January, leading to a significant surge in bullish momentum. Consequently, this heightened level of volatility in the market has now resulted in a noteworthy price correction.
Universal Market Access Market Data
- UMA/USD Price Now: $6.117
- UMA/USD Market Cap: $471,357,121
- UMA/USD Circulating Supply: 76,347,191 UMA
- UMA/USD Total Supply: 117,750,777 UMA
- UMA/USD CoinMarketCap Ranking: #110
Key Levels
- Resistance: $7.00, $7.50, and $8.00.
- Support: $4.00, $3.50, and $3.00.
Universal Market Access Forecast: Analyzing the Indicators
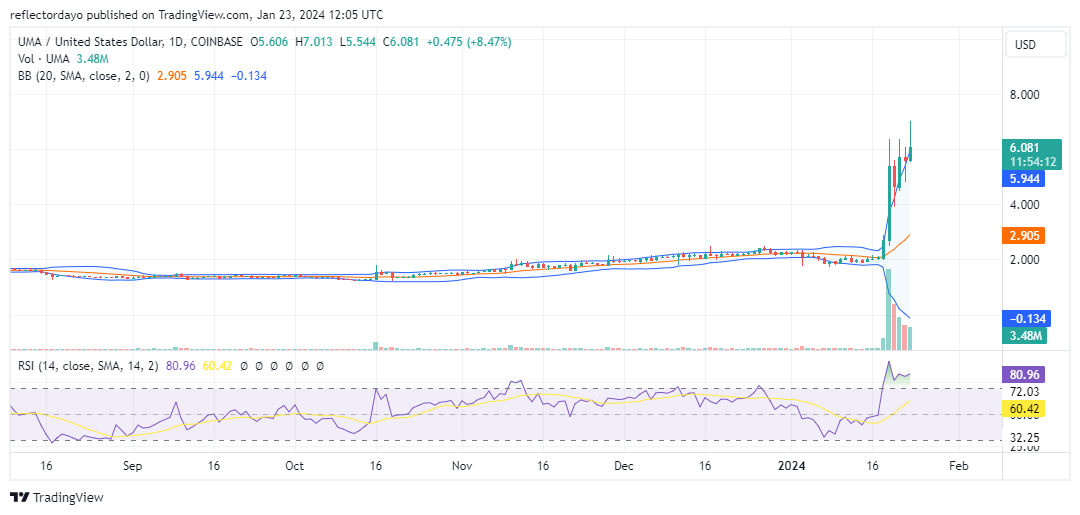
The strong and hyper-bullish trend that commenced on January 17 has a dual impact, as evidenced by a significant divergence in the Bollinger Bands, indicating an explosion of volatility in the market. This phenomenon elucidates the substantial nature of the ongoing correction phase. Nevertheless, the bull market continues to maintain its dominance, with indications that the Universal Market Access bulls are striving to establish a support level at $5.538.
Upon scrutiny of the Relative Strength Index (RSI), it is evident that the price is firmly situated in overbought territory. Despite the correction, the RSI line has consistently registered at the 80 level for the past three days. This suggests a potential for further price correction until the RSI lines begin to measure below the 70 level.
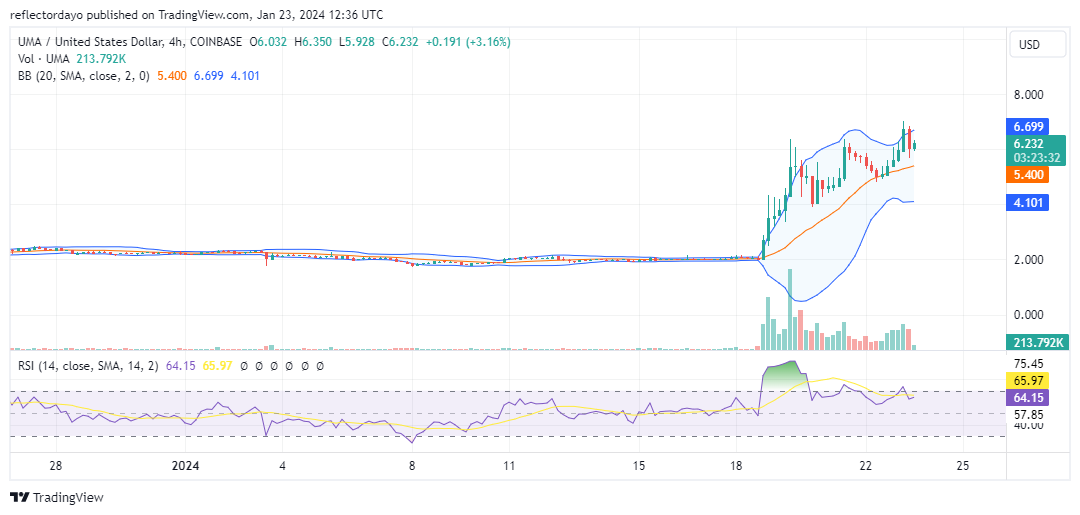
UMA/USD 4-Hour Chart Outlook
From the perspective of the 4-hour chart outlook on the market, the indicators suggest that the trend is sustainable. This conclusion is drawn from the significant height of the histograms in the volume of trade indicator, indicating substantial interest from investors in the market. Additionally, the formation of higher lows provides another reason to anticipate a bullish market performance. Presently, a new support level is in the process of formation around $6.00.
Traders are advised to closely monitor the volume of trade to gauge whether the bullish momentum will persist, drawing insights from the height of the histogram.