The AMP/USD Market Is Poised to Surpass the $0.004 Threshold
Estimated Reading Time: 3 minutes
Don’t invest unless you’re prepared to lose all the money you invest. This is a high-risk investment and you are unlikely to be protected if something goes wrong. Take 2 minutes to learn more
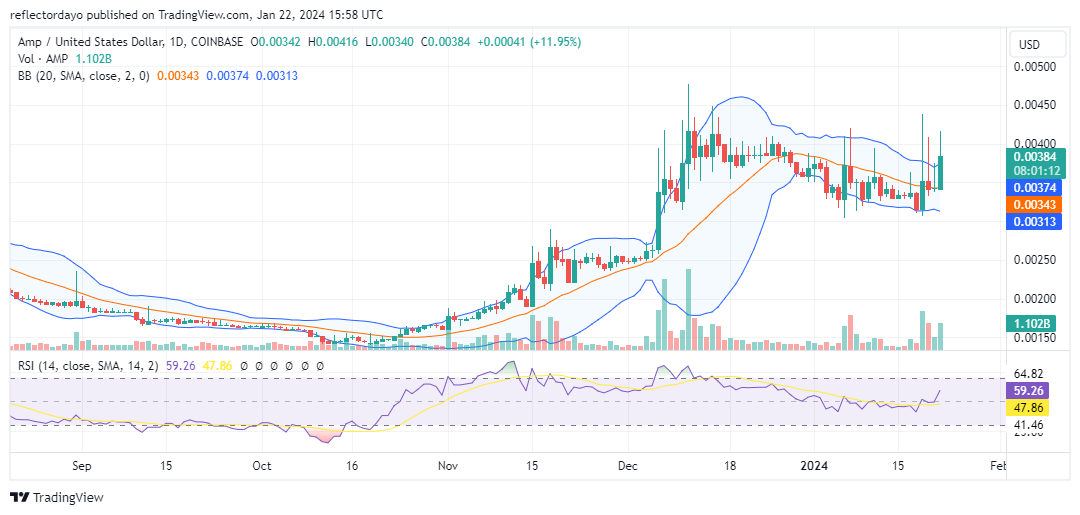
In the recent month, the Amp market exhibited a robust bullish trend, reaching its peak at $0.00476 approximately on December 11. Despite the bearish sentiment triggered at this level, resilient bullish momentum prevailed, stabilizing the price around $0.0033.
Throughout January, bullish traders have actively engaged in significant market activity. However, their attempts to breach the $0.004 resistance level have consistently faced rejection. Presently, the market appears to have established a crucial support level at $0.00341, potentially exerting pressure on bearish positions around the $0.004 mark.
The Amp Market Data
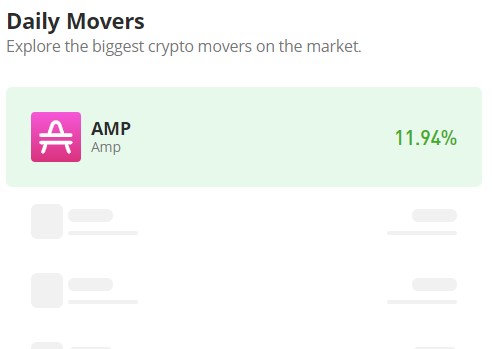
- AMP/USD Price Now: $0.00391
- AMP/USD Market Cap: $165,933,530
- AMP/USD Circulating Supply: 42,227,702,186 AMP
- AMP/USD Total Supply: 99,213,408,535 AMP
- AMP/USD CoinMarketCap Ranking: #280
Key Levels
- Resistance: $0.0040, $0.0045, and $0.0050.
- Support: $0.00340, $0.00300, and $0.00250.
The Amp Market Forecast: Analyzing the Indicators
Today’s trading session in the Amp market reflects strong and substantial bullish activity. However, the influence of bearish forces is still notable around the $0.004 mark, as evidenced by the upper shadow on today’s candle. The emergence of a new support level at $0.00343 appears to position the bull market for a potential breakthrough of the $0.004 resistance price level.
Currently, heightened market volatility is contributing to significant retracement during each trading session. Despite this, the prevailing bullish sentiment suggests a potential breach of the support level in the near future. If this occurs, breaking the resistance level amidst the current volatility may trigger further bullish momentum in the price movement.
The volume of trade indicator displays histograms of substantial height, providing support for the existing market dynamics. This significant trade volume confirms the ongoing bullish price movement. Additionally, the Relative Strength Index, measuring market momentum at 59, further validates the current market dynamics.
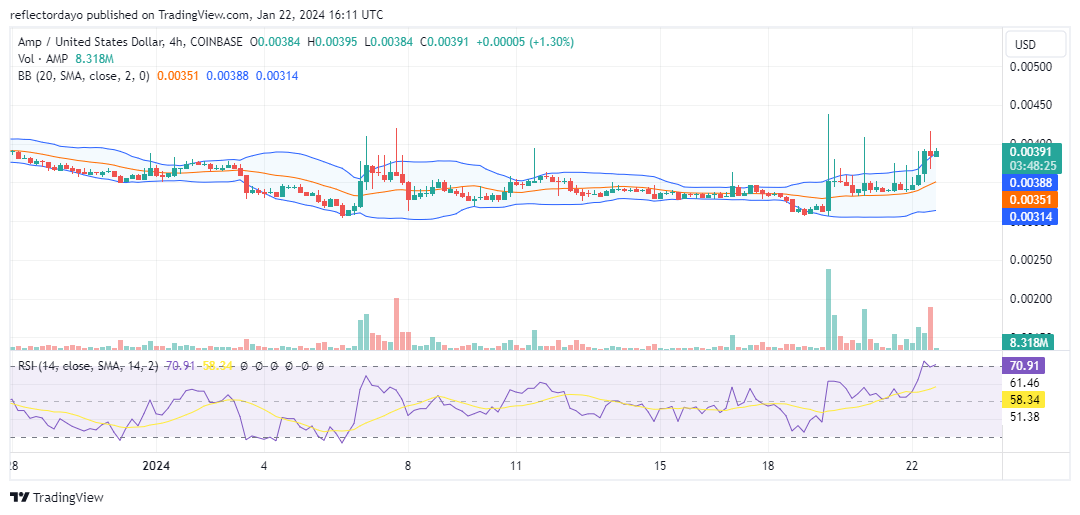
AMP/USD 4-Hour Chart Outlook
Analyzing the 4-hour chart perspective of the market, it becomes apparent that the market exhibited bullish tendencies during the initial three sessions today. However, in the fourth session, a spinning top candlestick symbolized a session marked by a significant volume of trading activity. Despite the substantial trading volume, a standoff between demand and supply ensued, resulting in the market stabilizing near $0.0039.
In the subsequent session, the present market sentiment is leaning towards a bullish outlook, although the volume of trade histogram remains relatively flat. It is conceivable that the market may consolidate around this level, indicating the possibility of encountering substantial resistance.