Decentraland (MANA/USD) Bullish Momentum Builds as Market Stabilizes Around $0.45
Estimated Reading Time: 3 minutes
Don’t invest unless you’re prepared to lose all the money you invest. This is a high-risk investment and you are unlikely to be protected if something goes wrong. Take 2 minutes to learn more
Initially, the Decentraland market appeared to be skewed towards the bullish side, which held a dominant position. However, when the market reached a peak price of $0.50 on November 20, the bearish aspect of the market gained momentum due to increased volatility. Despite a subsequent price pullback, the bulls solidified their position at the $0.40 price level. Building upon this support, the market attained a new higher level at $0.60. Subsequently, the bearish side exhibited a strong response, yet the bulls have consistently maintained a robust hold on the $0.40 price level, preventing any further decline below this threshold.
Decentraland Market Data
- MANA/USD Price Now: $0.4702
- MANA/USD Market Cap: $887,527,177
- MANA/USD Circulating Supply: 1,893,095,371 MANA
- MANA/USD Total Supply: 2,193,179,327 MANA
- MANA/USD CoinMarketCap Ranking: #74
Key Levels
- Resistance: $0.50, $0.55, and $0.60.
- Support: $0.45, $0.40, and $0.35.
Decentraland Market Forecast: Analyzing the Indicators
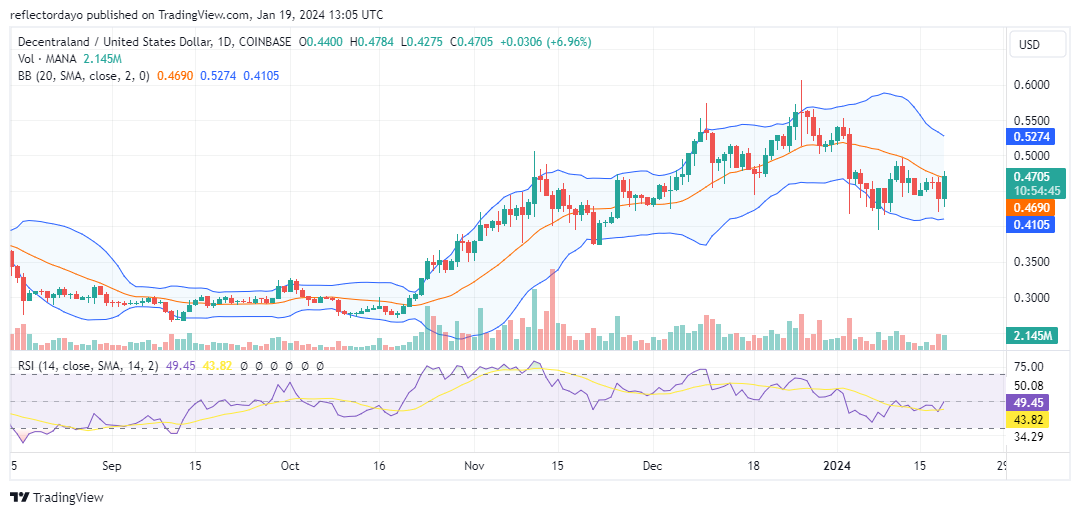
There was a surge in bearish sentiment in the Decentraland market, causing the price to closely approach the $0.40 level. However, a bullish response emerged within the same daily trading session. The market retested the $0.40 price level on January 8, and the swift rebound from this level underscores the strength of bullish sentiment in this price range. Since January 8, the bullish side has garnered sufficient momentum to drive the market upward, and currently, a higher support level has been established at around $0.45.
According to the indicators, today’s market performance suggests a recovery from the bearish zone. The current momentum of the market is now positioned at the midpoint of the Relative Strength Index. Similarly, in the Bollinger Bands indicator, the price action has surpassed the 20-day moving average.
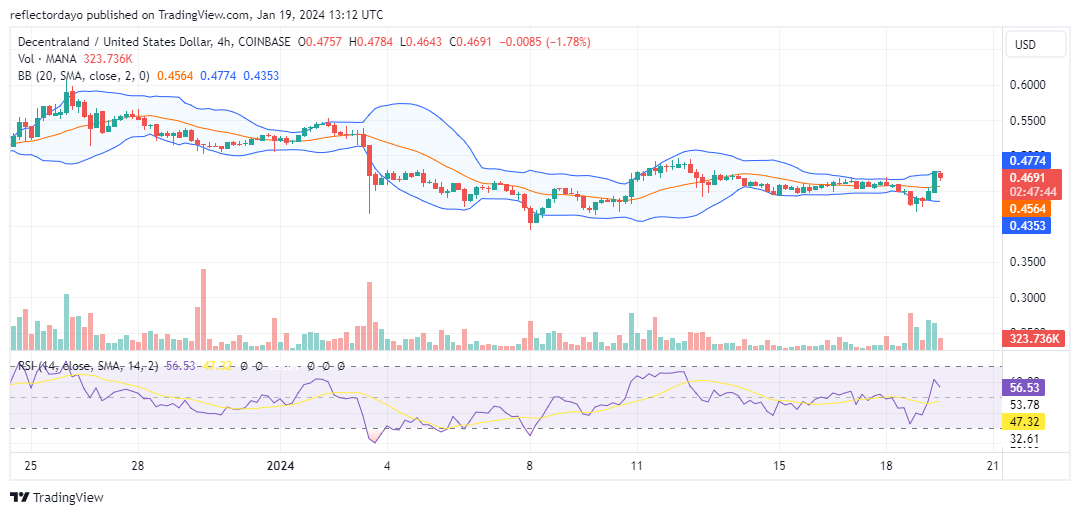
MANA/USD 4-Hour Chart Outlook
On a shorter timeframe, amidst the ongoing struggle between buyers and sellers, there is an apparent development of a consolidation trend. However, the bullish side appears to be firmly established above the $0.45 price level, as indicated by heightened trading volume in recent days. In the current session, the volume of trade indicator reflects a decline, suggesting a cooling of tension. This implies that the market may consolidate above the $0.45 price level. Such a development has the potential to establish a crucial support level, with the target remaining focused on the $0.60 price level.