Compound (COMP/USD) Price Consolidates at $56.00 as Bulls and Bears Engage in Market Battle
Estimated Reading Time: 3 minutes
Don’t invest unless you’re prepared to lose all the money you invest. This is a high-risk investment and you are unlikely to be protected if something goes wrong. Take 2 minutes to learn more
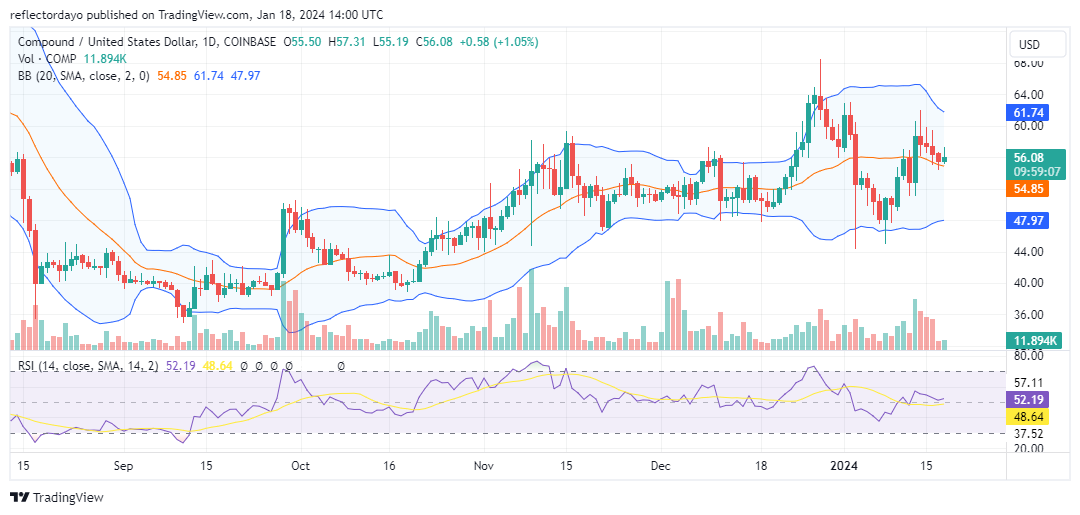
The support and resistance dynamics within the Compound market are displaying signs of convergence, and a potential point of confluence appears to be emerging around the $56.00 price level. Initially, the bearish market exhibited a strengthening momentum, with lower highs observed since the market peaked at $68 towards the end of last year. The consistent pattern of lower highs is indicative of a growing bearish trend.
However, a pivotal shift occurred in the market on January 13, when a support level was established around $53.00. This support level proved to be a significant turning point, introducing the possibility of market consolidation centered around the $56.00 price level. This shift in market dynamics suggests a potential equilibrium between bullish and bearish forces, warranting careful observation for further developments.
Compound Market Data
- COMP/USD Price Now: $56.33
- COMP/USD Market Cap: $456,245,838
- COMP/USD Circulating Supply: 8,068,918 COMP
- COMP/USD Total Supply: 10,000,000 COMP
- COMP/USD CoinMarketCap Ranking: #122
Key Levels
- Resistance: $60.00, $65.00, and $70.00.
- Support: $53.00, $50.00, and $45.00.
Compound Market Forecast: Analyzing the Indicators
In early January, a robust bear market emerged, nearly eroding the high price levels achieved by the bulls at the year-end of 2023, as bears drove the price down to around $45.00. Subsequently, bullish intervention successfully restored the price above the $50.00 level. The heightened bearish activity led to increased volatility, evident in the expansion of the Bollinger Bands.
However, as the bulls found support around the $52.00 price level, the Bollinger Bands indicator began exhibiting signs of convergence. This indicates a reduction in volatility, suggesting the potential for Compound market consolidation around the $56.00 price level. These market developments highlight the intricate interplay between bullish and bearish forces, necessitating continued vigilance for further insights.
COMP/USD 4-Hour Chart Outlook
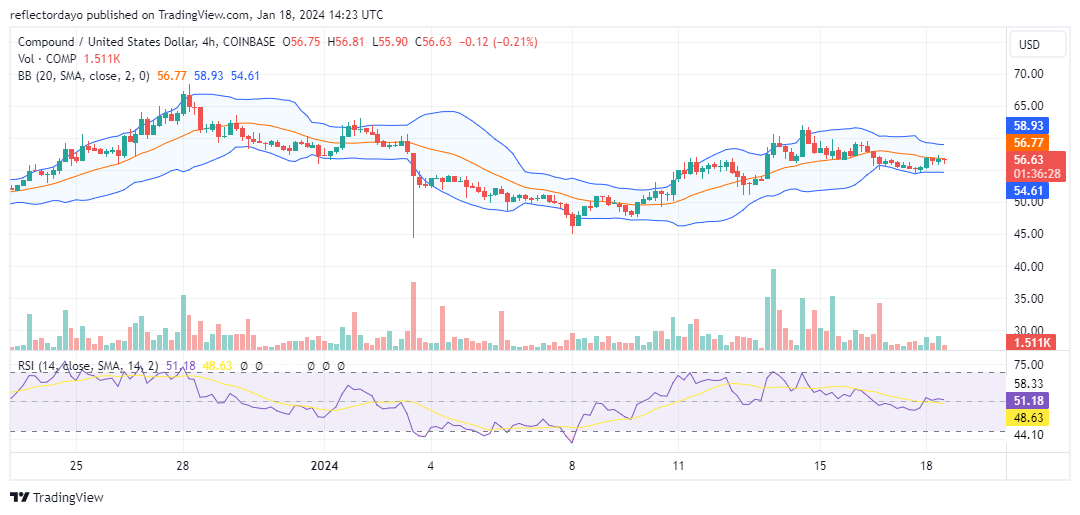
In a shorter timeframe, the market is currently undergoing consolidation, with price action gravitating towards the midpoint of the indicators employed in the analysis. Another confirmation of this consolidation trend is evident in the diminishing height of the volume histograms in the trade volume indicator. The ongoing deadlock between bulls and bears is resulting in a reduction in trading volume.
This market condition may lead to the establishment of either a support or a resistance level, ultimately guiding the market in a discernible direction. The resolution of this consolidation phase will likely provide clarity on the prevailing market sentiment and determine the subsequent trajectory.