ApeCoin (APE/USD): Indications Point to the Start of a New Bullish Cycle
Estimated Reading Time: 3 minutes
Don’t invest unless you’re prepared to lose all the money you invest. This is a high-risk investment and you are unlikely to be protected if something goes wrong. Take 2 minutes to learn more
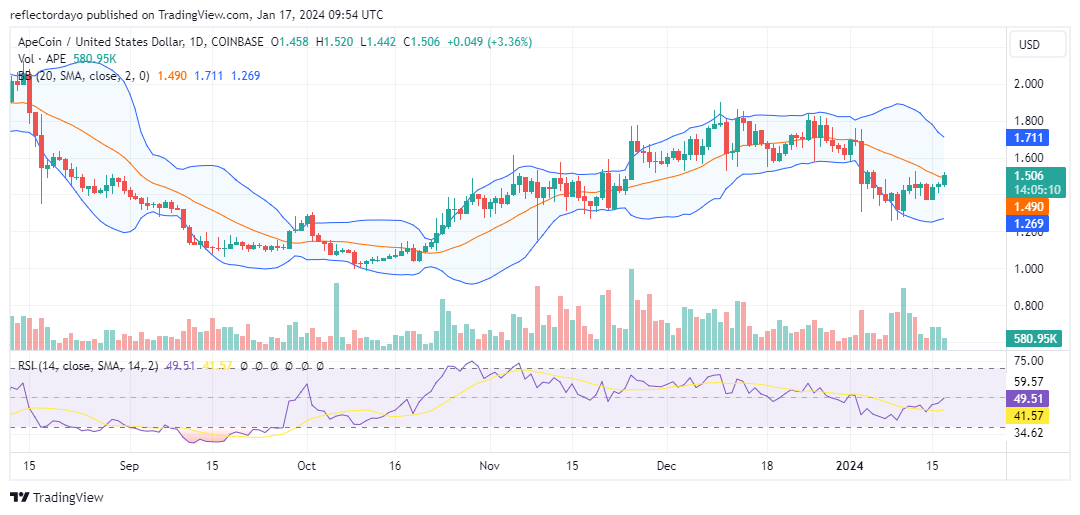
In December of the previous year, the ApeCoin bull market reached its peak, reaching approximately $1.80. The bullish surge encountered significant resistance at the $1.80 level, leading to a clash between bullish and bearish sentiments. This resulted in a market consolidation period from December 11 to the year-end. As the new year commenced, bearish forces gained dominance, causing the price to decline to the support level established on November 21 at $1.327. Subsequently, a support level was established in this range, marking a pivotal moment where the market shifted course, initiating an upward trajectory as bullish momentum gained strength.
ApeCoin Market Data
- APE/USD Price Now: $1.516
- APE/USD Market Cap: $539,639,406
- APE/USD Circulating Supply: 368,593,750 APE
- APE/USD Total Supply: 1,000,000,000 APE
- APE/USD CoinMarketCap Ranking: #106
Key Levels
- Resistance: $1.60, $1.70, and $1.80.
- Support: $1.40, $1.35, and $1.30.
ApeCoin Market Forecast: Analyzing the Indicators
The $1.327 price level serves as the pivotal support that played a crucial role in the previous bullish cycle, reaching its zenith at $1.800. Despite the strong bullish momentum, the price failed to surpass the $1.800 mark. Presently, a price retracement is underway, targeting the $1.800 threshold. In today’s market, characterized by a robust bullish candlestick, there is a notable 3.4% gain.
According to indicators, the bullish forces are steadily closing the gap with the ApeCoin bear market, propelling the market towards its midpoint. If the bulls can sustain their upward momentum, there is potential for the market to reach its target.
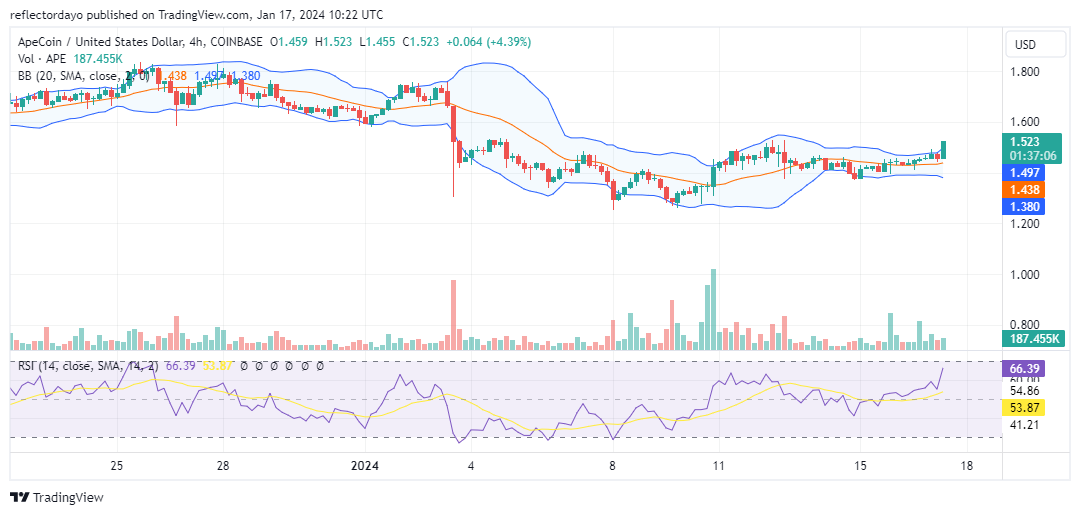
APE/USD 4-Hour Chart Outlook
Examining the 4-hour chart perspective, a nuanced bullish trend has been evident since January 15, elevating the market above the 20-day moving average. In today’s trading session, the current 4-hour timeframe indicates a notable surge in bullish sentiment, propelling the price significantly higher. Presently, the relatively low trading volume suggests a degree of caution regarding the sustainability of this movement. Notably, the Bollinger Bands indicator did not exhibit a substantial divergence corresponding to the price movement.
There are two plausible scenarios to consider. On one hand, the current price movement may lack sustainability, given the modest volume and the Bollinger Bands’ behavior. On the other hand, it is equally possible that this upswing could attract increased bullish sentiment, potentially driving the price toward the target. Careful monitoring of market dynamics will be essential to discern the true trajectory of this movement.

