Wall Street Memes (WSM/USD) Price Powers Up, Flexing Muscles
Estimated Reading Time: 3 minutes
Don’t invest unless you’re prepared to lose all the money you invest. This is a high-risk investment and you are unlikely to be protected if something goes wrong. Take 2 minutes to learn more

Wall Street Memes Price Prediction – July 2
The predominant trajectory in market engagements pairing the Wall Street Memes coin with the U.S. dollar benchmark has remained anchored at the lower axis, as the crypto-economic market now undergoes structural re-calibration and oscillates with measured cadence—powering up and flexing momentum.
WSM/USD has exhibited repeated price recoveries around the $0.0006 zone, reinforcing a stable demand floor near the $0.0005 level. This sustained reaction within the lower Bollinger Band region implies strategic buyer interest. The narrowing band formation reflects diminishing volatility, often preceding an upward breakout scenario.
WSM/USD Market
Key Levels
Resistance levels: $0.0007, $0.0008, $0.0009
Support levels: $0.0005, $0.0004, $0.0003
WSM/USD – 4-Hour Chart
The WSM/USD 4-hour chart reveals that the crypto-economic price now powers up, flexing momentum in its driving indexes.
The stochastic oscillators continue to swing within a dynamic range, signaling sustained interplay between bullish and bearish forces in a rhythmically balanced market environment. Meanwhile, the Bollinger Bands are outlining key price zones where accumulating buy-side interest is likely to emerge, offering favorable trade setups amid controlled volatility.
Is the $0.0006 Level Poised to Influence the Next Major Move in WSM/USD?
From the overall technical point of viewing, it appears that the $0.0006 line poises to cause the next major move in WSM/USD market, just as the trade output shows that the price powers up, flexing momentum.
With price action coiling near the $0.0006 threshold, WSM/USD appears to be transitioning out of a compression zone, reflecting a maturing accumulation phase. The contraction in volatility signals a potential energy build-up, while waning bearish pressure underscores a shift in market control. As support continues to solidify and buy-side flows deepen, conditions are aligning for a bullish continuation, likely reinforced by growing institutional presence and reinforced market confidence.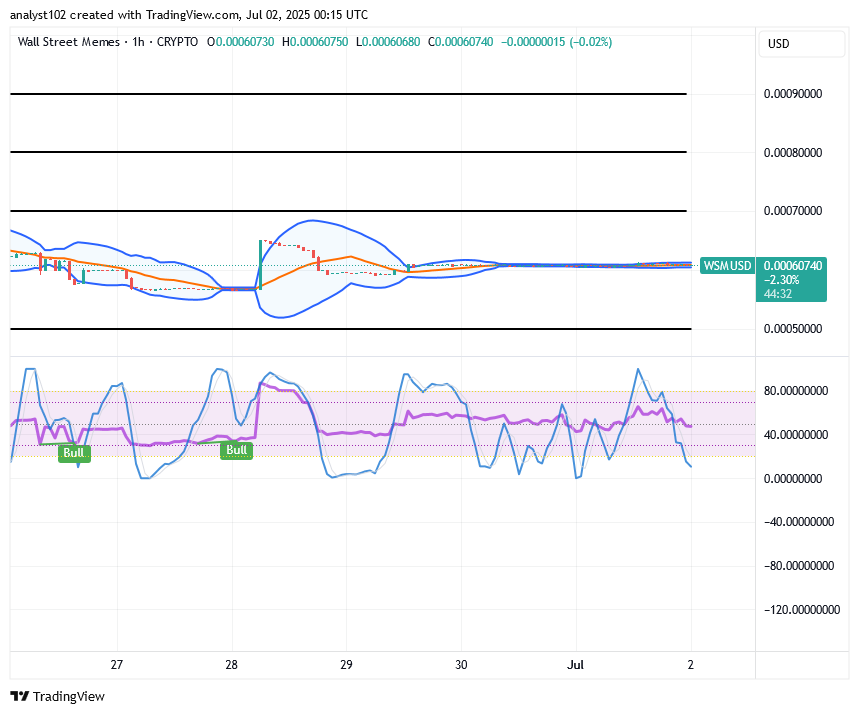
WSM/USD 1-Hour Chart
The 1-hour chart, as of this piece, has it that the WSM/USD trade’s price powers up, flexing momentum in its set-up.
The stochastic oscillators have steadily fluctuated in both upward and downward trajectories, reflecting intensifying momentum and a developing directional bias. Concurrently, the Bollinger Bands indicators have tightened and aligned horizontally around the $0.0006 zone, signifying a contracting volatility range and heightened breakout anticipation.
$WSM/$USDT is now tradeable on #Bybit Perpetuals, unlocking leveraged exposure, amplified liquidity, and seamless execution.
$WSM community, we saw your Tweets! 👏$WSM / $USDT is now tradeable on #Bybit Perpetuals.
— Bybit (@Bybit_Official) October 13, 2023
Trade here: https://t.co/le4XyVyXaZ
Also want your project listed? Share your suggestions here:https://t.co/W7EWJVVNV5 https://t.co/XgXoL7g0rF