Wall Street Memes (WSM/USD) Trade Re-bases, Jerking Steady
Estimated Reading Time: 3 minutes
Don’t invest unless you’re prepared to lose all the money you invest. This is a high-risk investment and you are unlikely to be protected if something goes wrong. Take 2 minutes to learn more

Wall Street Memes Price Prediction – July 1
The overriding trending path in the business activities that paired Wall Street Memes coin with the purchasing power of the American currency has been observed at a lower end, as the crypto-economic market presently rebases, jerking steadily.
Multiple rebound formations have consistently emerged around the $0.0006 price axis, establishing a firm underlying support near the $0.0005 zone. This sustained activity suggests that bullish momentum is steadily building, positioning WSM/USD market buyers to potentially breach overhead resistance levels and advance beyond the previously capped price thresholds.
WSM/USD Market
Key Levels
Resistance levels: $0.0007, $0.0008, $0.0009
Support levels: $0.0005, $0.0004, $0.0003
WSM/USD – 4-Hour Chart
The WSM/USD 4-hour chart demonstrates that the crypto-economic trade rebases on a usual format, jerking steadily around the line of $0.0006.
The trending styles of the Bollinger Bands show prospective trade areas that purchasing orders are feasible enough to outweigh disadvantages. On the basis of a bullish signal note, the stochastic oscillators have been oscillating up and down via different positions.
Can the WSM/USD Market Build on the $0.0006 Line to Regain Bullish Momentum?
As there has been continuity in the way that the WSM/USD market has been trading around the line of $0.0006, hope has continued to rise positively, as the crypto market rebases, jerking steadily around the point in question.
Based on current price behavior around the $0.0006 trade line, the WSM/USD market seems to be finalizing its consolidation phase, hinting at a potential bullish breakout. Bearish momentum is fading as volatility narrows, allowing buyers to gradually reclaim control. Strengthening support at this level, combined with rising accumulation and improved sentiment, points to increasing institutional engagement and a likely continuation to the upside. 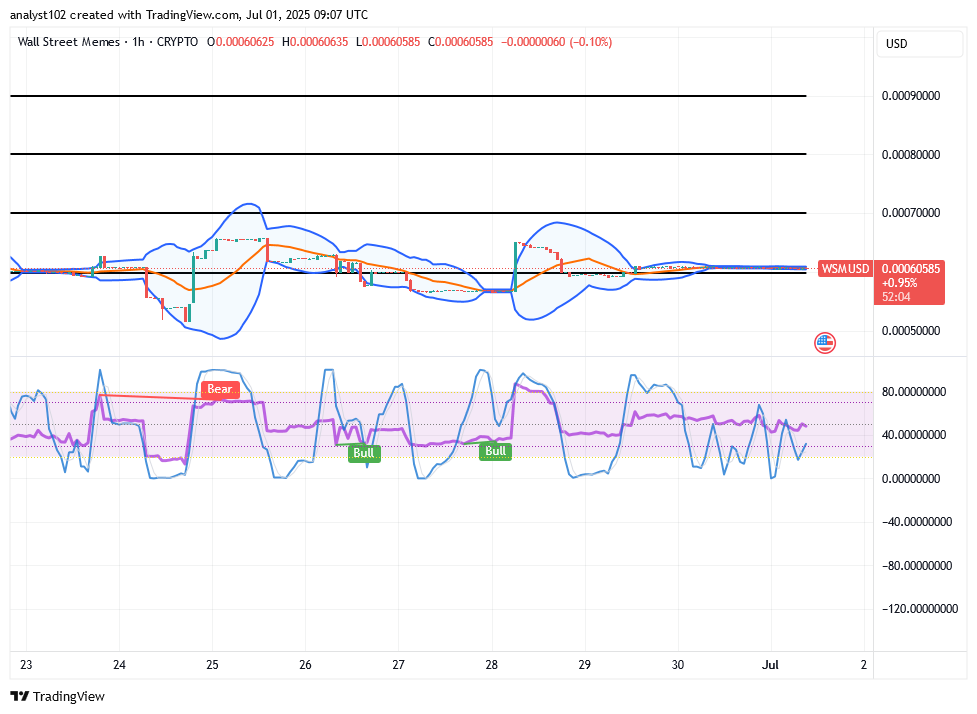
WSM/USD 1-Hour Chart
The 1-hour chart reveals that the WSM/USD market rebases, jerking around the line of $0.0006.
The Bollinger Bands’ trend lines, as of the time of this analysis, have been conjoined, stretching flatly in the territories of $0.0006, indicating a tightening volatility range. The stochastic oscillators have remained actively pulling both upward and downward on the threshold of being bullish, reflecting growing momentum and potential directional bias.
BIGTIMEUSDT and WSMUSDT futures contracts are now officially live on Bybit Exchange!
🚀 BIGTIMEUSDT & WSMUSDT Contracts now on Bybit!
— Bybit (@Bybit_Official) October 12, 2023
Dive into new trading opportunities with 1-25x leverage. Plus, they’re now on Bybit Futures Grid Bot! Start trading now.
📈 BIGTIME: https://t.co/FAQlbhnzAh
📈 WSM: https://t.co/pb2y2AfMBE#CryptoTrading #Bybit