Wall Street Memes (WSM/USD) Trade Slows, Fueling Baselines
Estimated Reading Time: 4 minutes
Don’t invest unless you’re prepared to lose all the money you invest. This is a high-risk investment and you are unlikely to be protected if something goes wrong. Take 2 minutes to learn more
Wall Street Memes Price Prediction – May 29
Buying and selling actions that showcase the presence of bulls and bears in the business operation of Wall Street Memes coin, as paired with the market purchasing power of the US dollar, have been seen making the crypto trade slow down, fueling baselines.
The market structure remains firmly bullish, with $0.001 and $0.0005 acting as strong accumulation zones. Dips into these levels continue to attract buyers, confirming high-probability long setups. Momentum supports the upside, showing sustained demand. Short-term consolidations appear healthy within the broader uptrend. Bearish pressure remains limited and short-lived.
WSM/USD Market
Key Levels
Resistance levels: $0.001, $0.0015, $0.002
Support levels: $0.0005, $0.0004, $0.0003
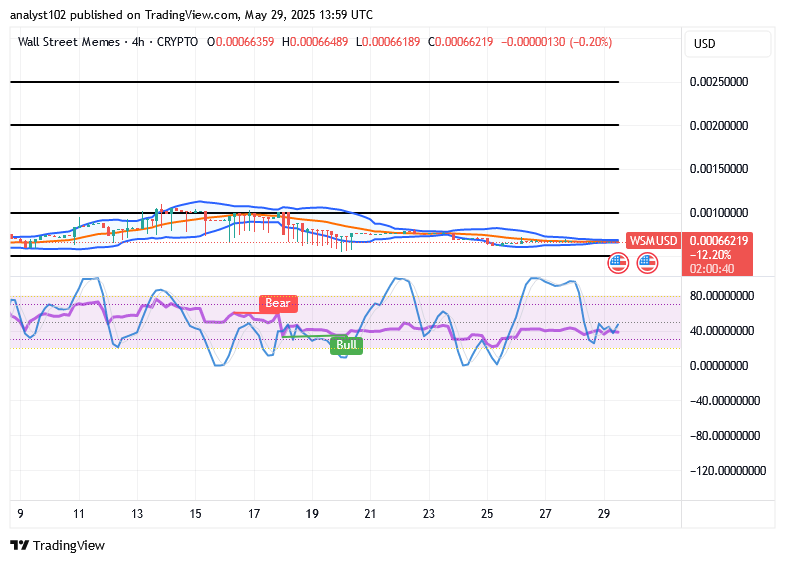
WSM/USD – 4-hour Chart
The WSM/USD 4-hour chart demonstrates that the crypto-economic trade slows down actions, fueling baselines.
The stochastic oscillators are showing a downward trend in the areas of 40 points, which increases the chances of a price increase soon and creates a good opportunity for buying, especially as market sentiment improves steadily. The Bollinger Bands exhibit intensified lateral divergence, sustaining a compression phase bounded by the $0.0005 to $0.001 thresholds, often a precursor to bullish breakout momentum building up.
Can the WSM/USD market capitalize on growing opportunities to break key thresholds and reignite bullish momentum?
It is likely that buyers are taking time to solidify their positions amid growing opportunities, as the WSM/USD market continues to move within varying range sizes; as the crypto economy is currently slowing down, fueling baselines.
Based on the prevailing market structure, the WSM/USD pair appears to be completing its corrective phase, signaling a potential inflection point for upward continuation. With bearish pressure dissipating and volatility compressing, demand-side liquidity is gradually increasing. Strengthening accumulation zones and improving sentiment suggest growing institutional interest, and strategic entries at current levels may yield long-term upside as bullish structures solidify.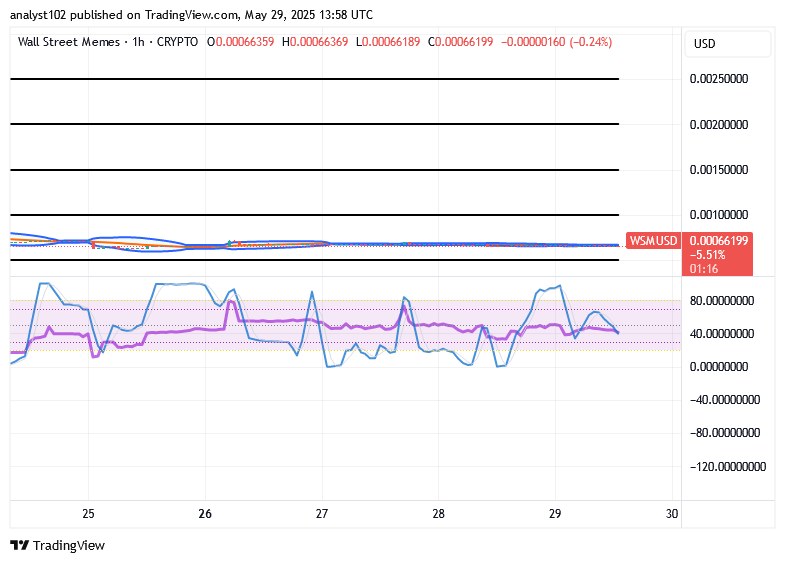
WSM/USD 1-hour chart
The 1-hour chart depictures it that the WSM/USD market slows in its movements pattern, fueling baselines.
The Bollinger Bands indicate strengthening buying activity, as market participants explore multiple re-entry points amid heightened volatility and tightening price action. Meanwhile, the stochastic oscillators are currently fluctuating around the 40-point threshold, suggesting that buyers are likely to encounter favorable entry conditions. This confluence of signals reinforces bullish momentum, encouraging sustained accumulation and optimism for upward continuation.
BIGTIMEUSDT & WSMUSDT Contracts Now Live on Bybit!
Explore fresh trading opportunities with up to 25x leverage — now available on Bybit Futures Grid Bot. Jump in and start trading today!
🚀 BIGTIMEUSDT & WSMUSDT Contracts now on Bybit!
— Bybit (@Bybit_Official) October 12, 2023
Dive into new trading opportunities with 1-25x leverage. Plus, they’re now on Bybit Futures Grid Bot! Start trading now.
📈 BIGTIME: https://t.co/FAQlbhnzAh
📈 WSM: https://t.co/pb2y2AfMBE#CryptoTrading #Bybit