Wall Street Memes (WSM/USD) Price Feeble, Garnering Catalysts
Estimated Reading Time: 3 minutes
Don’t invest unless you’re prepared to lose all the money you invest. This is a high-risk investment and you are unlikely to be protected if something goes wrong. Take 2 minutes to learn more

Wall Street Memes Price Prediction – May 28
Purchasers are deliberately taking their time to build up a significant push, as buying and selling activities surrounding the Wall Street Memes coin show limited immediate motion relative to the value of the U.S. dollar, as the technical situation has it that the crypto-economic trade is feeble, garnering catalysts in the proceedings.
The ongoing market activity suggests that downward price pressures are gradually diminishing over time, creating an encouraging atmosphere for investors. As this steady sentiment strengthens, the accumulation of confident and strategic long position orders becomes increasingly favorable. With a powerful and long-expected rebound likely to occur abruptly in the near future, the setup appears potentially profitable for those positioned early.
WSM/USD Market
Key Levels
Resistance levels: $0.0015, $0.002, $0.0025
Support levels: $0.0005, $0.0004, $0.0003
WSM/USD – 4-hour Chart
The medium-term chart (4-hour chart) of the WSM/USD market is feeble in the pushing motion, garnering catalysts.
The Bollinger Bands have persistently contracted in a systemic, volatility-compressing pattern, gradually stretching toward the lower boundary within the $0.001 to $0.0015 support zone. This narrowing range reflects diminishing momentum and growing consolidation. Concurrently, the stochastic oscillators have sharply deviated southbound into the deeply oversold region, signaling a probable exhaustion of bearish pressure and suggesting an imminent rebound opportunity.
Could the current WSM/USD sideways be a strategic pause for buyers to prep for re-entry?
Being as it is, the WSM/USD market’s sideways movement has to be logically regarded as a strategic price impulse for long-term purchasers to take advantage of, as the base instrument is feeble in its movements, garnering catalysts.
Based on current chart dynamics, the market’s price action is displaying a series of lower highs forming in smaller, controlled increments. This pattern, while cautious, suggests that buyers are strategically positioning themselves to trigger bullish catalysts that may accelerate renewed momentum and support a more sustainable upside recovery in the near term.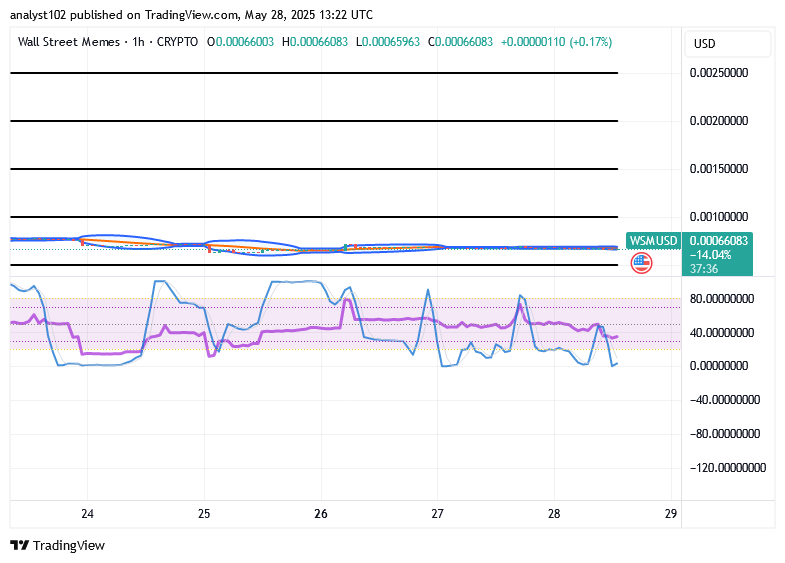
WSM/USD 1-hour chart
The WSM/USD market’s 1-hour chart showcases that the crypto-economic market is feeble, garnering catalysts.
The stochastic oscillators are in a persistently dynamic mode, suggesting that the current swerving motions are working to establish a structural basis for potential directional bias. Simultaneously, the Bollinger Bands have consistently stretched eastward within a compressed range, indicating reduced volatility and reinforcing ongoing consolidation and market indecision.
$WSM / $USDT is now actively tradeable on #Bybit Perpetuals, offering leverage trading, enhanced liquidity, and 24/7 market access for advanced traders.
$WSM community, we saw your Tweets! 👏$WSM / $USDT is now tradeable on #Bybit Perpetuals.
— Bybit (@Bybit_Official) October 13, 2023
Trade here: https://t.co/le4XyVyXaZ
Also want your project listed? Share your suggestions here:https://t.co/W7EWJVVNV5 https://t.co/XgXoL7g0rF