Wall Street Memes (WSM/USD) Trade Lessens, Adding Muscles
Estimated Reading Time: 3 minutes
Don’t invest unless you’re prepared to lose all the money you invest. This is a high-risk investment and you are unlikely to be protected if something goes wrong. Take 2 minutes to learn more
Wall Street Memes Price Prediction – May 27
Buying and selling activities in the market operations of Wall Street Memes coin versus the market’s worth of American dollars have been slightly put into a condition that attracts little active motion, just as the crypto-economic trade lessens movements, adding muscles in its output settings.
The WSM/USD market is moving sideways between $0.001 and $0.0005, showing that buyers are taking their time to build positions. The slow and steady trading suggests accumulation rather than panic selling, so short-term dips shouldn’t be mistaken for a major downtrend.
WSM/USD Market
Key Levels
Resistance levels: $0.0015, $0.002, $0.0025
Support levels: $0.0005, $0.0004, $0.0003
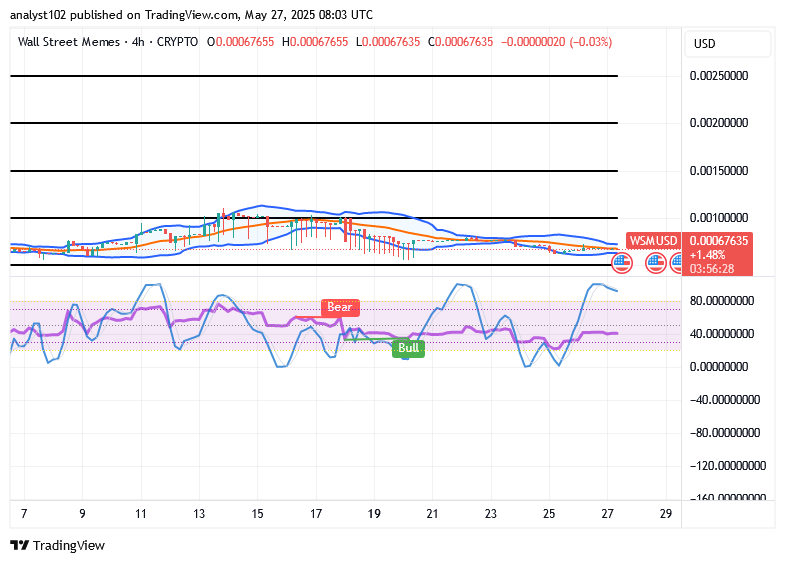
WSM/USD – 4-hour Chart
The medium-term chart (4-hour chart) of the WSM/USD trade lessens actions, adding muscles from a basement perspective.
The Bollinger Bands exhibit a mild downward slope with contracting width, indicating a market in consolidation where buyers appear to be gradually positioning for potential long exposure and selective profit-taking. This behavior suggests a preparatory phase ahead of a possible breakout. Meanwhile, the stochastic oscillators are steadily climbing toward the 80 threshold, reinforcing a constructive bias and signaling increasing bullish momentum. While the setup remains largely favorable, the ongoing compression warrants measured optimism, as short-term neutrality could persist before directional confirmation.
With consolidation deepening and oversold signals emerging, might shorts face a diminishing edge ahead?
Shorting position orders are most likely not going to get stable downfalls subsequently away from its current market’s level, given that the WSM/USD market lessens forces, adding muscles from a lower end.
As catalyst rebuilds and the price remains steady above key support, conditions increasingly favor an upside breakout—systematic buying is needed to sustain this setup, especially as indicators strengthen, consolidation tightens, and buyers gain control across multiple timeframes, reinforcing the bullish outlook and momentum broadens across supportive signals.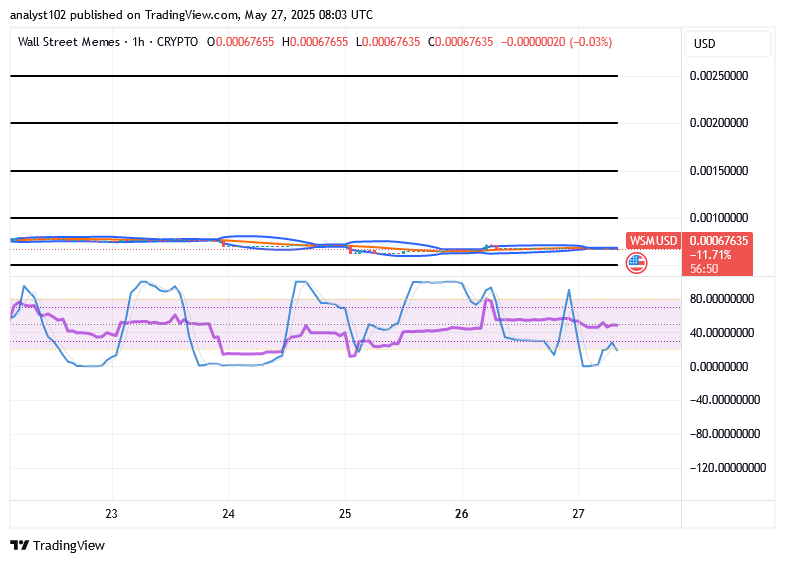
WSM/USD 1-hour chart
The 1-hour chart of the short-term setup reveals that the crypto-economic trade lessens movements, adding muscles to its baseline.
The Bollinger Bands are tightening horizontally between $0.001 and $0.0005, signaling a stable consolidation zone that typically precedes a clear directional resolution. The stochastic oscillators are in the oversold region, denoting a trade signal caution to the downside.
Stake Now and Earn More ➡️ https://wallstmemes.com/en/dashboard
🔥 Up To 44% APY Now Available 🔥
— Wall Street Memes (@wallstmemes) October 6, 2023
Stake Now ➡️ https://t.co/X031FQo0bW
Buy Now ➡️ https://t.co/kNJqZfssBZ pic.twitter.com/oQ6sKXJpcL