Bitcoin Cash (BCH/USD) Market Holds Operations at $600
Estimated Reading Time: 3 minutes
Don’t invest unless you’re prepared to lose all the money you invest. This is a high-risk investment and you are unlikely to be protected if something goes wrong. Take 2 minutes to learn more
Bitcoin Cash Price Prediction – October 22
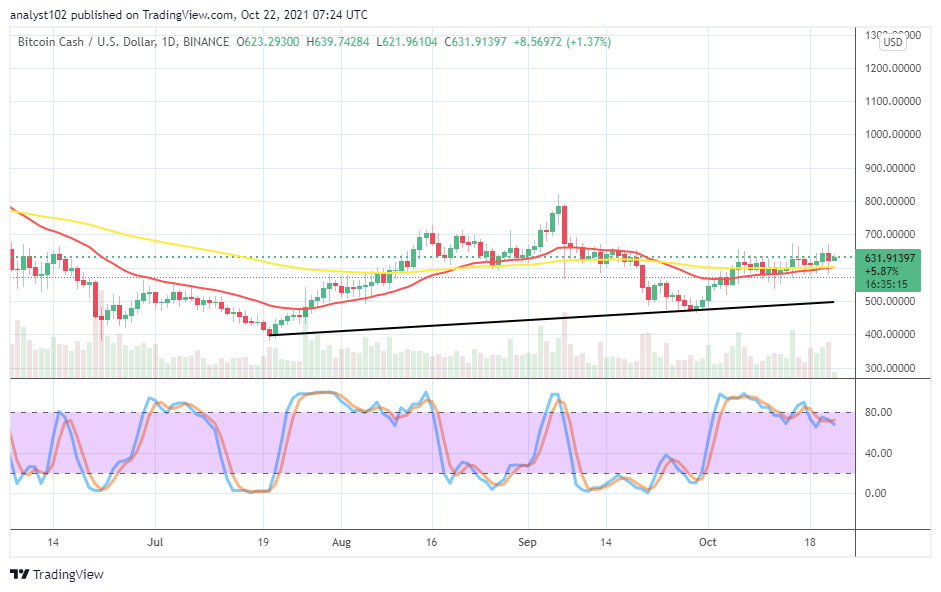
The BCH/USD market holds operations around $600 at a positive percentage rate of about 1.37. The crypto-economic price trades around the $631 value line to indicate a slight increase in valuation away from the level.
BCH/USD Market
Key Levels:
Resistance levels: $700, $800, $900
Support levels: $500, $400, $300
BCH/USD – Daily Chart
The daily chart showcases that the BCH/USD market holds operations around the level of $600 as there has been a series of not-too-shorter candlesticks signifying that price has been struggling to recover at that trading capacity line. The SMAs have joined together at the value line mentioned earlier. There is a trace that the 14-day SMA indicator is underneath the 50-day SMA indicator. The Stochastic Oscillators appear to be consolidating around the range of 80 and near into the overbought region. It has still appeared that the volatile movement of the market isn’t high.
Is it worthy of joining the trade currently as the market holds operations around $600?
There have been so many fewer inactive price actions in the BCH/USD trade as the market holds operations around the level of $600. It would be necessary that the crypto’s price moves a bit downward to test a support line around the conjoined area of the SMAs for a rebound. In the event of that scenario playing out, a decent buy entry will have its way. And, a breakout at the resistance level at $700 will portend the possibility of getting more upsides afterward.
On the downside of technical analysis, the BCH/USD market bears would have to watch for a movement systemically made toward touching the resistance level at $700. A downward reversal motion needed to occur to signal the start of the depression in the crypto’s price valuation before a sell order can consider. If the motion lacks volatility in its northward pushes, variant smaller bullish candlesticks may prevail in the market activities until the point to invalidate the possibility of getting a decent sell entry.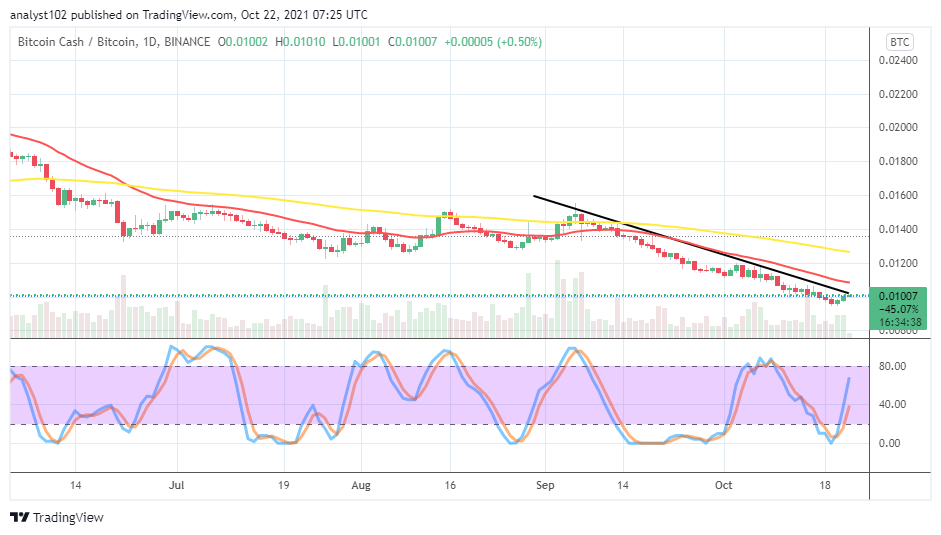
BCH/BTC Price Analysis
In comparison, Bitcoin Cash’s trending capability is under depression as paired with Bitcoin. The cryptocurrency pair market holds operations underneath the SMA trend lines. The 50-day SMA indicator is above the 14-day SMA indicator as the bearish trend line drew across them southward. The Stochastic Oscillators have swerved the lines from the oversold region below the range of 80. It is an indication that the base crypto is striving to regain its stance as paired with the flagship counter crypto.
Note: Cryptosignals.org is not a financial advisor. Do your research before investing your funds in any financial asset or presented product or event. We are not responsible for your investing results.
You can purchase crypto coins here. Buy Tokens