Binance Coin Is in a Sideways Move, Fluctuates Below $480 Resistance
Estimated Reading Time: 2 minutes
Don’t invest unless you’re prepared to lose all the money you invest. This is a high-risk investment and you are unlikely to be protected if something goes wrong. Take 2 minutes to learn more

Binance Coin (BNB) Long-Term Analysis: Bullish
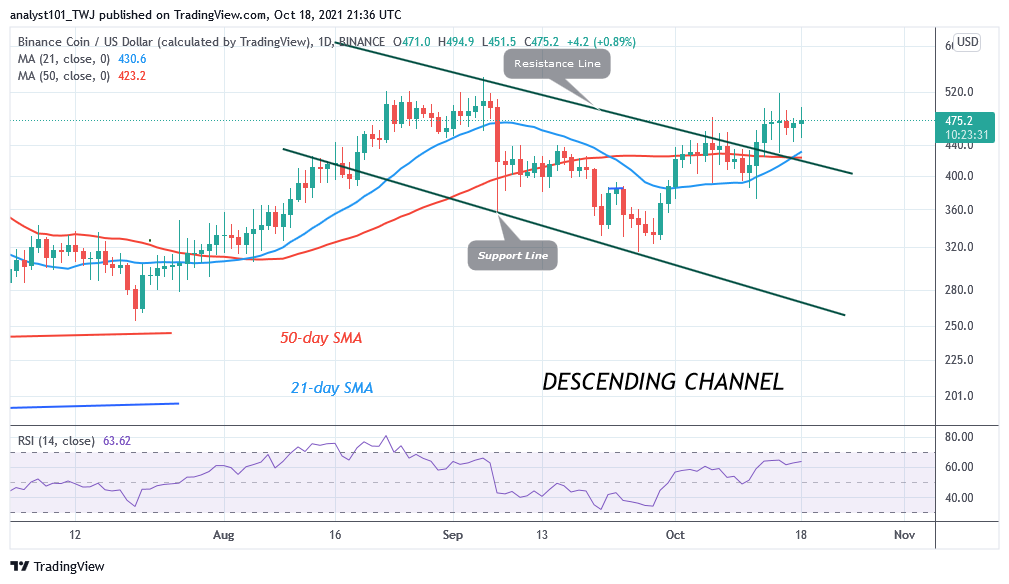
Binance Coin’s (BNB) price has broken above the moving averages. The uptrend has been stuck below the $480 resistance level. Today, the altcoin is consolidating below the $480 resistance level. The cryptocurrency may fall if buyers fail to sustain BNB prices above the resistance level. The current resistance level is the historical price level of September 7. Buyers are yet to break the resistance level. On September 7, the bears had the upper hand as the altcoin plunged to $340 low.
Binance Coin (BNB) Indicator Analysis
The market has risen to level 63 of the Relative Strength Index period 14. It indicates that BNB is in the uptrend zone and above the centerline 50. The crypto is also approaching the overbought region. It is above the 50% range of the daily stochastic. It indicates that BNB is in a bullish momentum.
Technical indicators:
Major Resistance Levels – $640, $660, $680
Major Support Levels – $540, $520, $500
What Is the Next Direction for Binance Coin (BNB)?
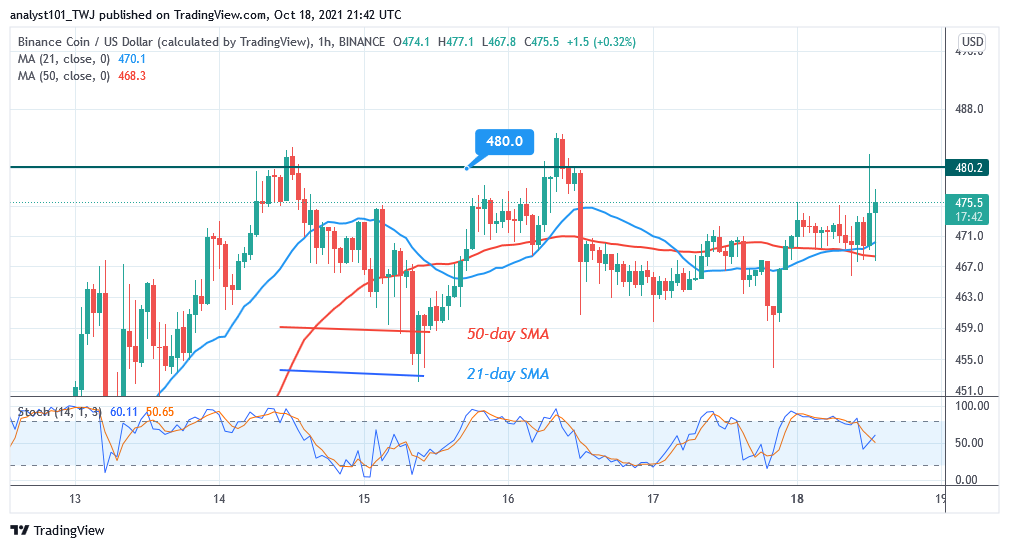
On the 4 –hour chart, BNB/USD is in a sideways move below the $480 overhead resistance zone. Since October 14, buyers have been struggling to break above the resistance level. The bulls have retested the overhead resistance thrice as the altcoin continued the sideways move. Today, the bulls have retested the resistance and pulled back. Another attempt is being made at the time of writing.
You can purchase crypto coins here. Buy Tokens
Note: Cryptosignals.org is not a financial advisor. Do your research before investing your funds in any financial asset or presented product or event. We are not responsible for your investing results