UMA (UMAUSD) Begins Another Consolidation Phase After Plunge in Price
Estimated Reading Time: 3 minutes
Don’t invest unless you’re prepared to lose all the money you invest. This is a high-risk investment and you are unlikely to be protected if something goes wrong. Take 2 minutes to learn more
UMA Market Analysis – Price Begins another Consolidation Phase
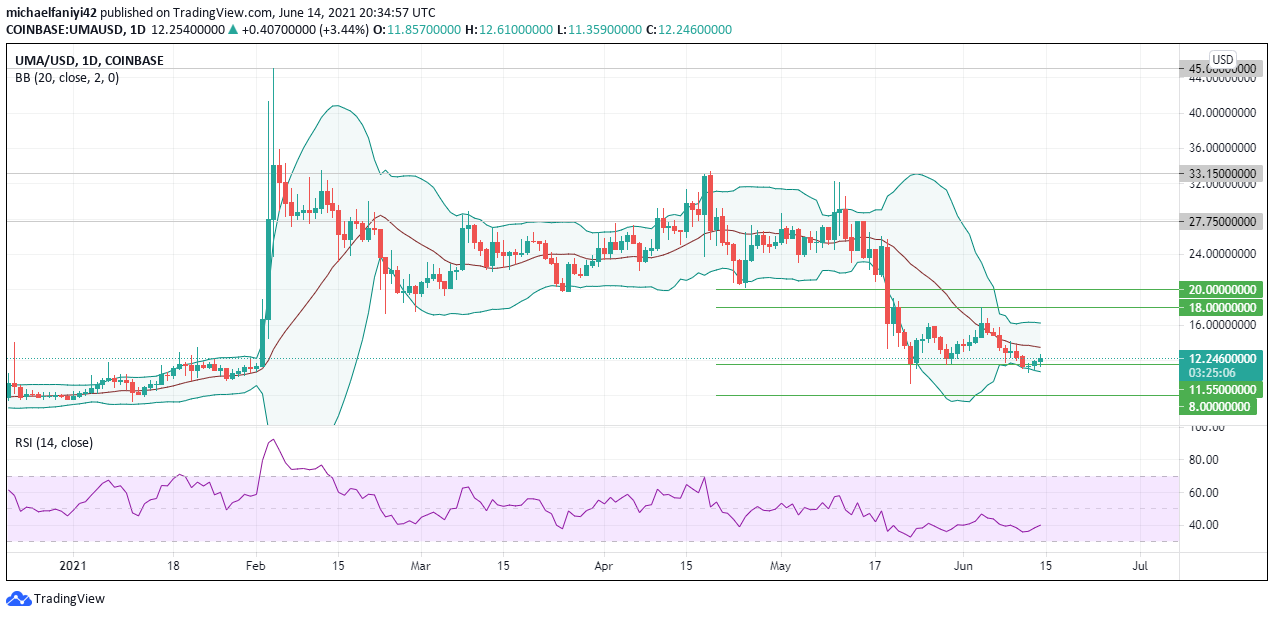
UMA begins another consolidation phase after the price plunge. The market had initially experienced a surge in price earlier this year on the 2nd of February 2021. The coin shot up within the space of three days from the $11.550 demand to $45.000 supply. The market was quickly knocked down by the resistance and it eventually fell below the $33.500 demand. Afterward, UMA conformed to a consolidation phase, zigzagging between that $33.500 supply and $20.000 demand.
Finally, UMAUSD broke out downward after 102 days of consolidation on the 19th of May 2021. The price was plunged beyond the $11.550 support. The buyers also acted quickly, but could not lift the coin beyond the $18.000 key level before the price fell back to the $11.550 support. The buyers have since tried the $18.000 resistance again but fell back yet again. UMA has now begun a new consolidation phase between these two zones.

UMA Major Zones
Supply Zones: $20.000, $18.000
Demand Zones: $11.550, $8.000
What to Expect as UMA Begins Consolidation Phase
The market is bullish once more, displaying two bullish candlesticks following a bullish spinning top candle. The Bollinger Band indicator helps to show market movement. The coin has been bouncing between the upper and lower bands, with the middle band acting as support/resistance. Currently, the coin, still in the consolidation phase has bounced off the lower border and is expected to reach again for $18.000 in another attempt to break it.
The RSI (Relative Strength Index) indicator has its signal line currently at 40.35 and looking upwards, showing there is still much scope for bullish movement.
On the 4-hour chart, the candlesticks have bounced off the lower border of the Bollinger Band and are currently bullish. The middle band which was above the candlesticks acting as resistance has now switched position to below the candles acting as a springboard for a push-up in price. The RSI indicator is currently at 55.19 and moving upwards. Its signal line is currently showing a retracement in the market.
UMAUSD will get to $18.000 again except the bears puts pressure on the market to drag it to $8.000.
Note: Cryptosignal.org is not a financial advisor. Do your research before investing your funds in any financial asset or presented product or event. We are not responsible for your investing results.