ChainLink (LINK/USDT) Seeks New Support After $16.00 Rejection
Estimated Reading Time: 3 minutes
Don’t invest unless you’re prepared to lose all the money you invest. This is a high-risk investment and you are unlikely to be protected if something goes wrong. Take 2 minutes to learn more

ChainLink Long-term Analysis: Bearish
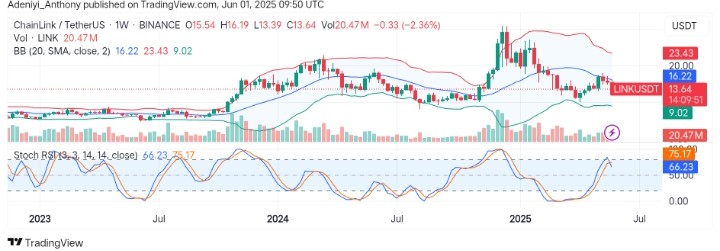
ChainLink against the Tether has reflected a cool-off, trading 2.36% below the previous candle on the week. However, despite earlier recovery signals, the pair has struggled to maintain bullish strength near its mid-Bollinger Band. As it stands, momentum indicators hint at a potential shift, but no breakout has been confirmed yet.
Recently, the lines of the Stochastic RSI displayed a bearish crossover near overbought territory, suggesting waning bullish strength as the price plummeted below the dynamic Bollinger Band at $16.22.
Currently, ChainLink trades at $13.64, recording over 20.47 million traded volumes for the week.
Technical Indicators
Major Resistance Levels: $16.22, $20.00, and $23.43
Major Support Levels: $13.00, $11.00, and $7.00
ChainLink Technical Analysis
The analysis of Chainlink against the Tether on a weekly chart shows the pair has faced a strong resistance around the dynamic mid-line of the Bollinger Bands, after which it has experienced a pull-down by the bears with potential support around $11.00. However, the Bollinger Bands appear compressed, suggesting a sharp move is coming soon.
From the other hand, the Stochastic oscillator curls downward, hinting that upward momentum might be exhausted as the lines point to the south.
To this end, a breakdown from $13.00 could target $10.00 swiftly, while a breakout above $16.50 may reignite a bullish trend continuation.
LINK/USDT Analysis: What’s Next?
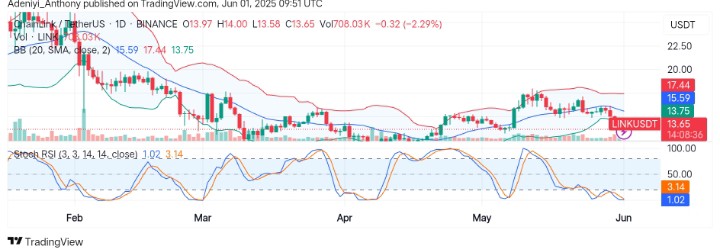
The analysis on the daily chart suggests LINK/USDT is on a bearish movement, closing below the dynamic line at $15.59. This indicates sellers control the market in the short term. However, the Bollinger Bands flatten, indicating a reduced volatility with a likely U-turn ahead.
As it stands, the pair trades under the 20 SMA, showing distribution. However, the Stochastic RSI displays an oversold situation, hinting at a potential weak bounce despite the volume.
To this end, the price action suggests that unless LINK reclaims $15.59 decisively, a move below the $10.00 level could materialize.
You can purchase crypto coins here. Buy LBlock