UMA (UMAUSD) Continues to Move in a Bullish Channel
Estimated Reading Time: 2 minutes
Don’t invest unless you’re prepared to lose all the money you invest. This is a high-risk investment and you are unlikely to be protected if something goes wrong. Take 2 minutes to learn more

Free Crypto Signals Channel
UMAUSD Analysis – The Market Continues to Move in a Bullish Channel
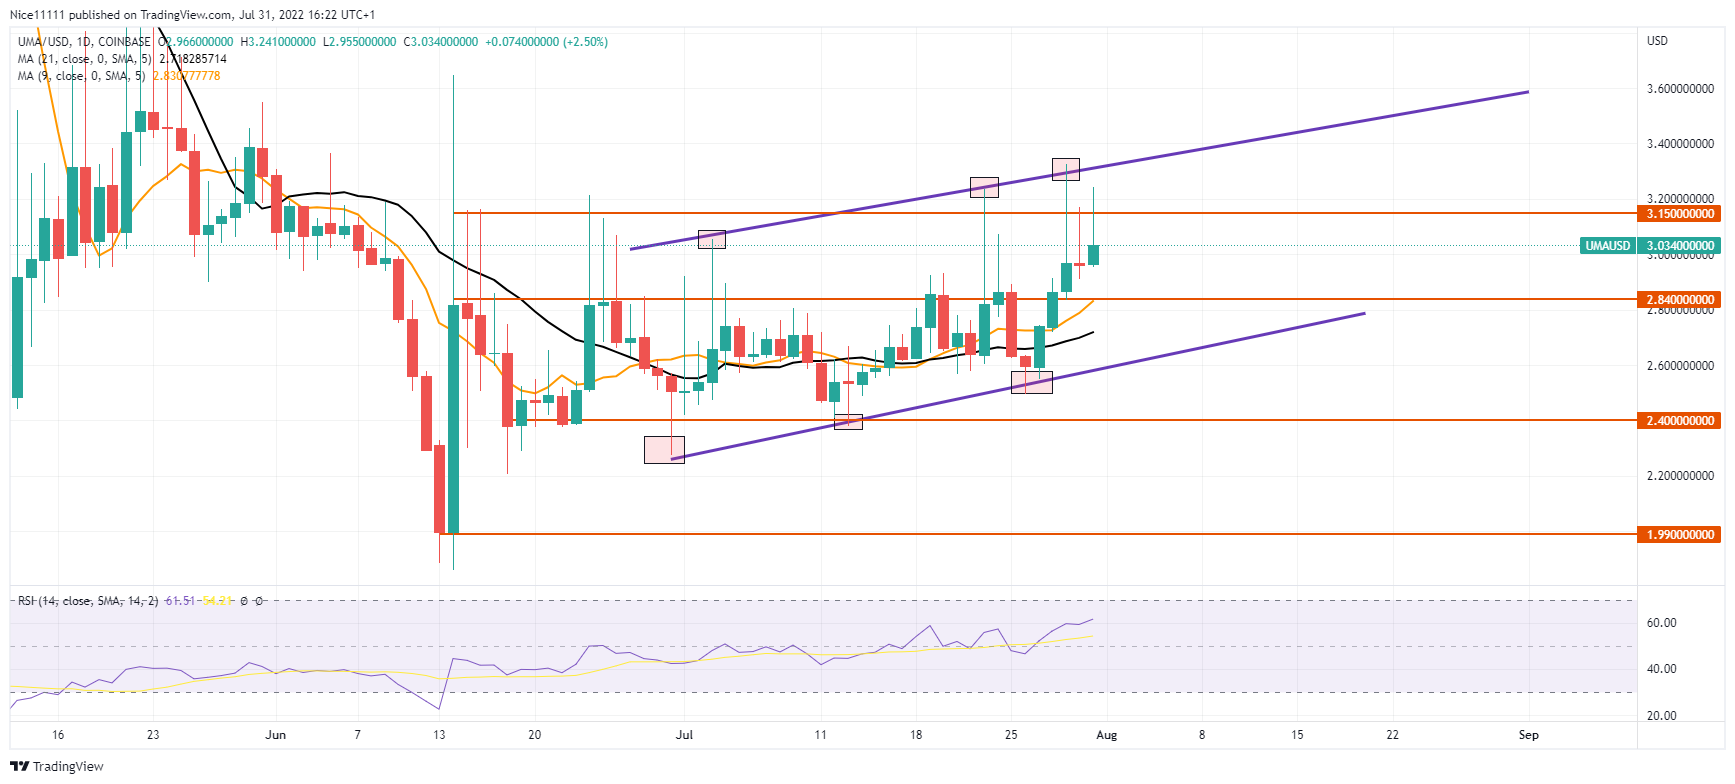
UMAUSD continues to rise in a bullish channel. UMAUSD reached its oversold region during the month of June. A bullish spike led the market away from the oversold zone.
UMAUSD Key levels
Supply levels: $3.150, $2.840
Demand levels: $2.400, $1.990
The market crashed to the $1.990 demand level after the formation of a head and shoulders bearish reversal pattern, which formed in the month of May. Multiple gaps were deposited in the last four bearish candles that rushed to $1.990. The market reversed suddenly and filled up the inefficiency created by the bears. A sharp rejection formed above the bullish candle that bounced off $1.900 The majority of the trading volume existed between $2.840 and $2.400 between late June and July.
Multiple false breakouts existed above the resistance level at $2.840 and the support level at $2.400. The Moving Averages (periods nine and twenty-one) crossed sideways continuously to show the period of consolidation during the month of July. The Moving Averages rested on the bodies of the daily candles during the period when the market was ranging. The market has shown a willingness to move in the bullish trend with its price action. The bodies of the daily candles have formed above $0.2840. On the daily timeframe, the Moving Averages have also rested below the daily candles to show an ascending trend in the bullish channel.
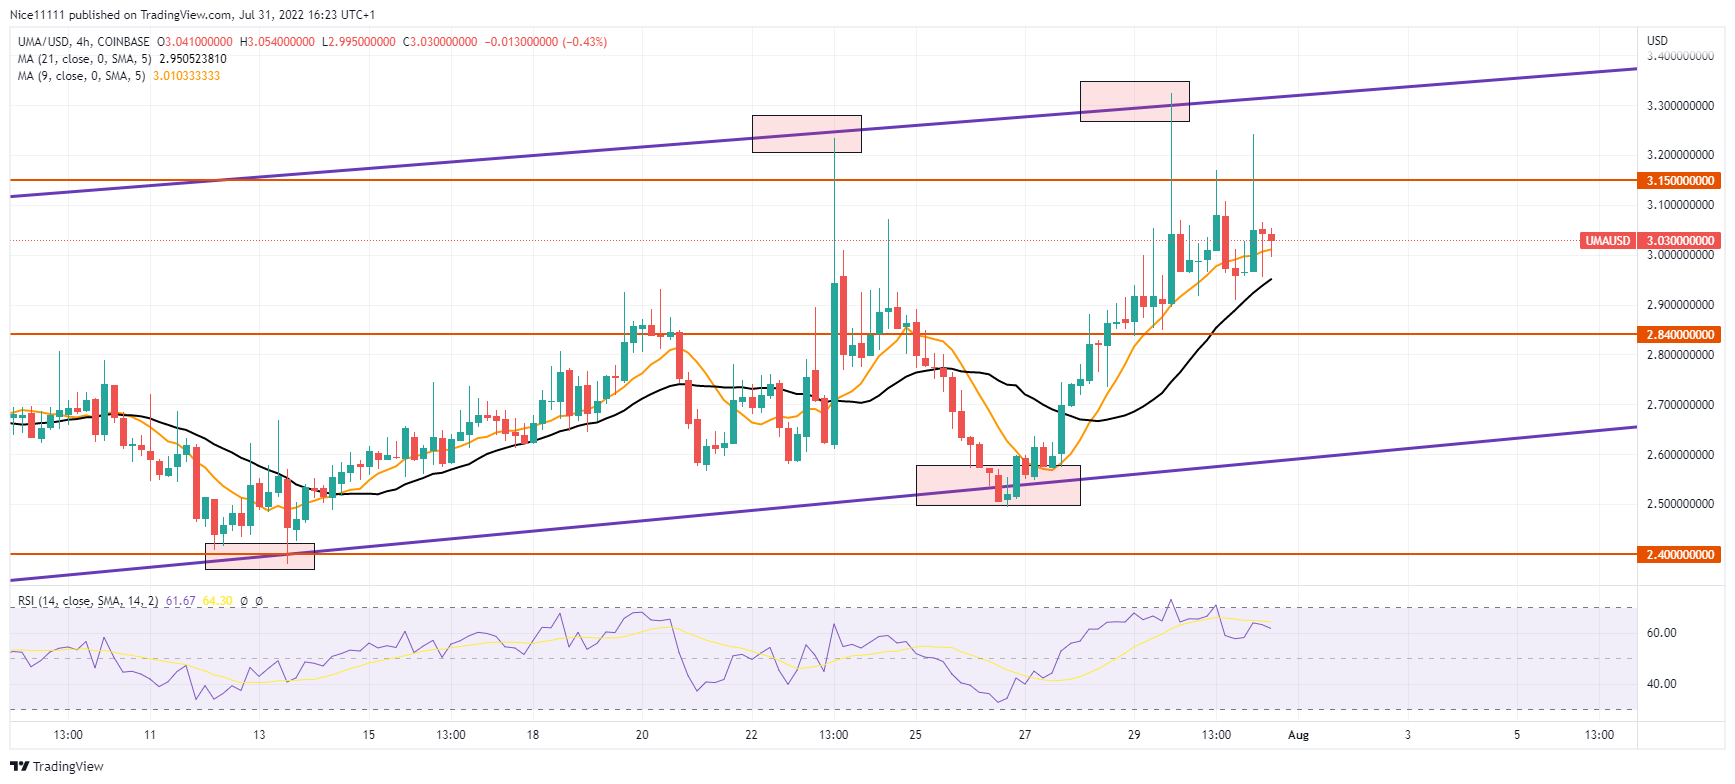
Market Expectation
On the four-hour chart, the market has formed an obvious higher high to show the change of the market state from ranging to bullish. A higher low has also been formed to reveal the uptrend of the market. The market is expected to push above the supply level at $3.150 in the bullish channel.
You can purchase Lucky Block here. Buy LBLOCK:
Note: Cryptosignals.org is not a financial advisor. Do your research before investing your funds in any financial asset or presented product or event. We are not responsible for your investing results.