Binance Coin Makes an Upward Correction, Battles the $320 Resistance
Estimated Reading Time: 2 minutes
Don’t invest unless you’re prepared to lose all the money you invest. This is a high-risk investment and you are unlikely to be protected if something goes wrong. Take 2 minutes to learn more

Free Crypto Signals Channel
Binance Coin (BNB) Long-Term Analysis: Bearish
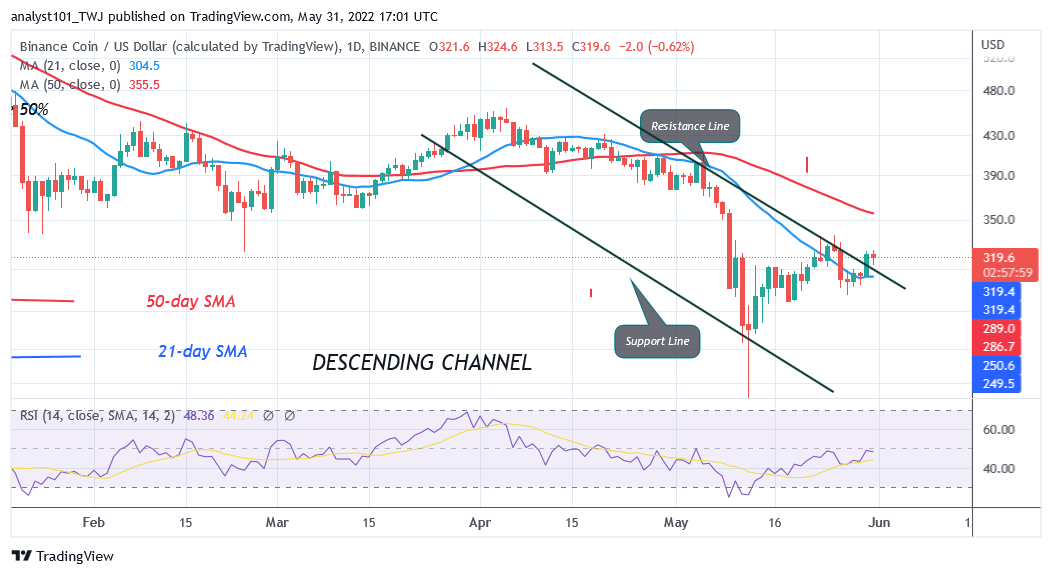
Binance Coin’s (BNB) price is in a downtrend as it battles the $320 resistance. The bulls have broken above the 21-day line SMA but could not break above the $320 resistance. Buyers have made two attempts to break the resistance level but were repelled. BNB price is now above the 21-day line SMA but below the 50-day line SMA. The altcoin is expected to be in a sideways move for a few more days in between the moving average lines.
Binance Coin (BNB) Indicator Analysis
BNB is at level 49 of the Relative Strength Index period 14. It indicates that there is a balance between supply and demand. The altcoin is in the downtrend zone despite the upward correction. BNB price bars are above the 21-day line SMA but below the 50-day line SMA indicating a possible range bound movement of the coin. It is above the 40% range of the daily stochastic. The 21-day line SMA and the 50-day line SMA are sloping southward indicating the downtrend.
Technical indicators:
Major Resistance Levels – $640, $660, $680
Major Support Levels – $540, $520, $500
What` Is the Next Direction for Binance Coin (BNB)?
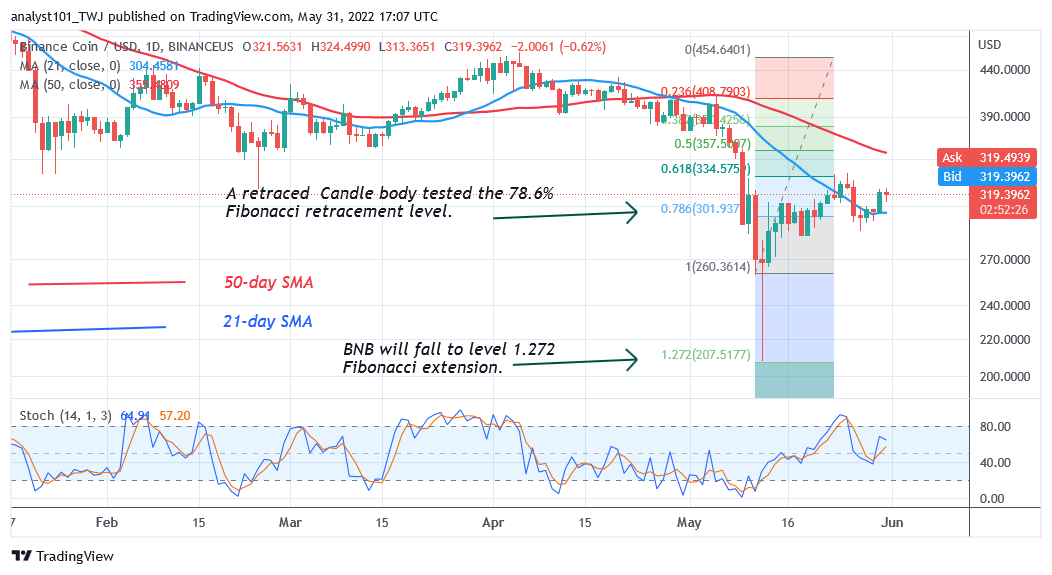
Binance Coin is now in an upward correction as it battles the $320 resistance. Meanwhile on May 11 downtrend; a retraced candle body tested the 78.6% Fibonacci retracement level. The retracement suggests that BNB will fall to level 1.272 Fibonacci extension or $207.51.
You can purchase crypto coins here. Buy LBLOCK
Note: Cryptosignals.org is not a financial advisor. Do your research before investing your funds in any financial asset or presented product or event. We are not responsible for your investing results