Uniswap (UNI) Price Prediction: UNI/USDT Price May Fall Lower
Estimated Reading Time: 3 minutes
Don’t invest unless you’re prepared to lose all the money you invest. This is a high-risk investment and you are unlikely to be protected if something goes wrong. Take 2 minutes to learn more

Uniswap (UNI) Price Prediction: October 17
The Uniswap market has experienced a notable price increase recently. This upward momentum pushed the token’s price past the $7.00 mark and through $8.00. However, the price action failed to establish support above $8.00, leading to a downward retracement that caused the market to fall below this level.
UNI/USDT Long-term Trend: Bullish (Daily Chart)
Key Price Levels:
Resistance: $8.00, $9.00, $10.00
Support: $7.00, $6.00, $5.00
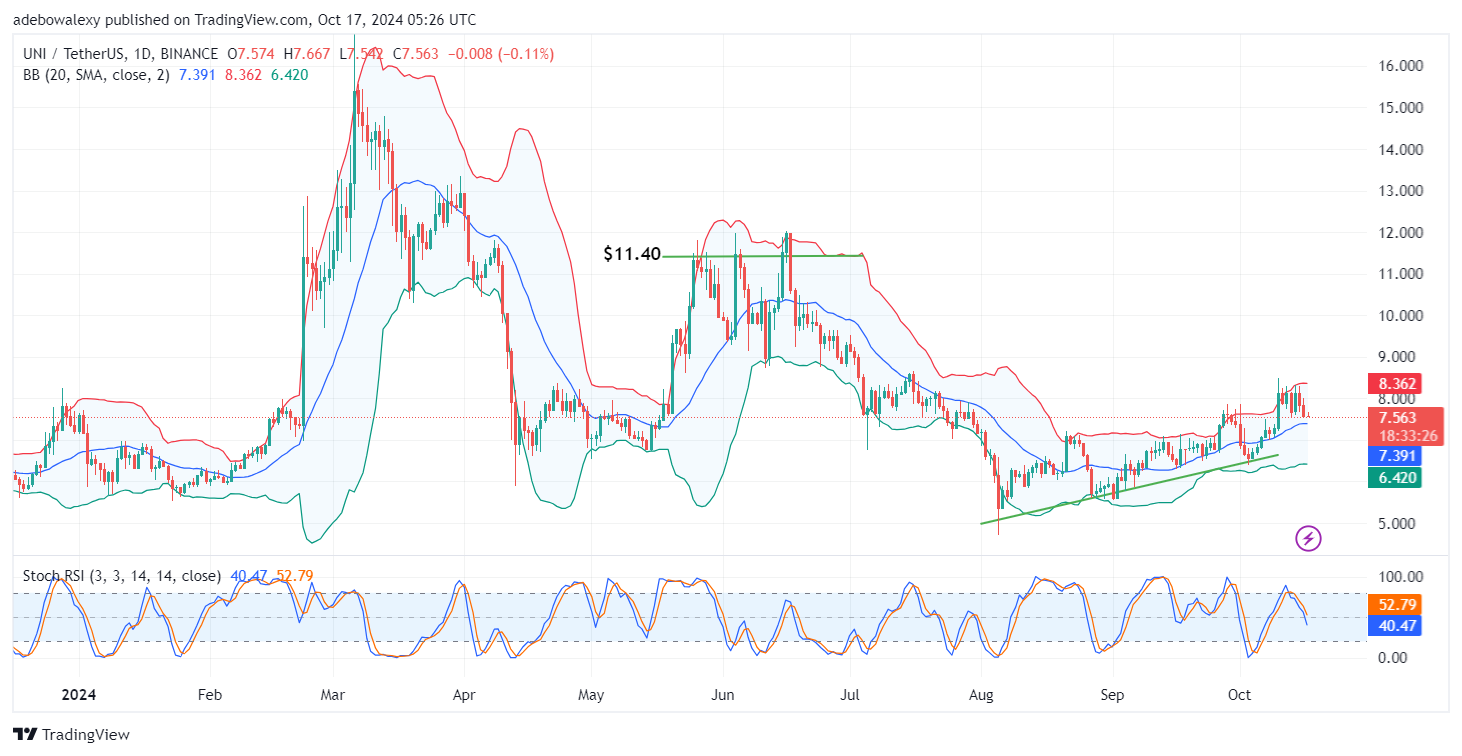
Uniswap is now trading around the $7.50 price level. The most recent price candle has appeared red and is positioned above the middle Bollinger Band. Despite this, the market continues to form higher lows. However, the Stochastic Relative Strength Index (Stochastic RSI) lines are sharply falling into the oversold region, with the leading line already below the 50 mark.
Uniswap (UNI) Price Prediction: UNI/USDT Market Under Bearish Pressure
Price action in the Uniswap daily market suggests that the token is under significant bearish pressure. This is evident as more bearish price candles have appeared on the chart since the price hit the upper band of the Bollinger Bands indicator. However, the latest price candle still stands above the middle Bollinger Band.
The appearance of this last candle suggests that the market may be attempting to halt the bearish corrections. However, the Stochastic RSI lines continue to move downward, signaling the need for caution and closer analysis of price movements in the near term.
Uniswap (UNI) Price Prediction: UNI/USDT May Decline Further (4-Hour Chart)
On the 4-hour Uniswap price chart, it becomes clearer that price activity may be preparing to move lower. The price has just broken through a previous support level on the chart. Additionally, price action is now below the middle Bollinger Band and is approaching the lower band of the indicator.
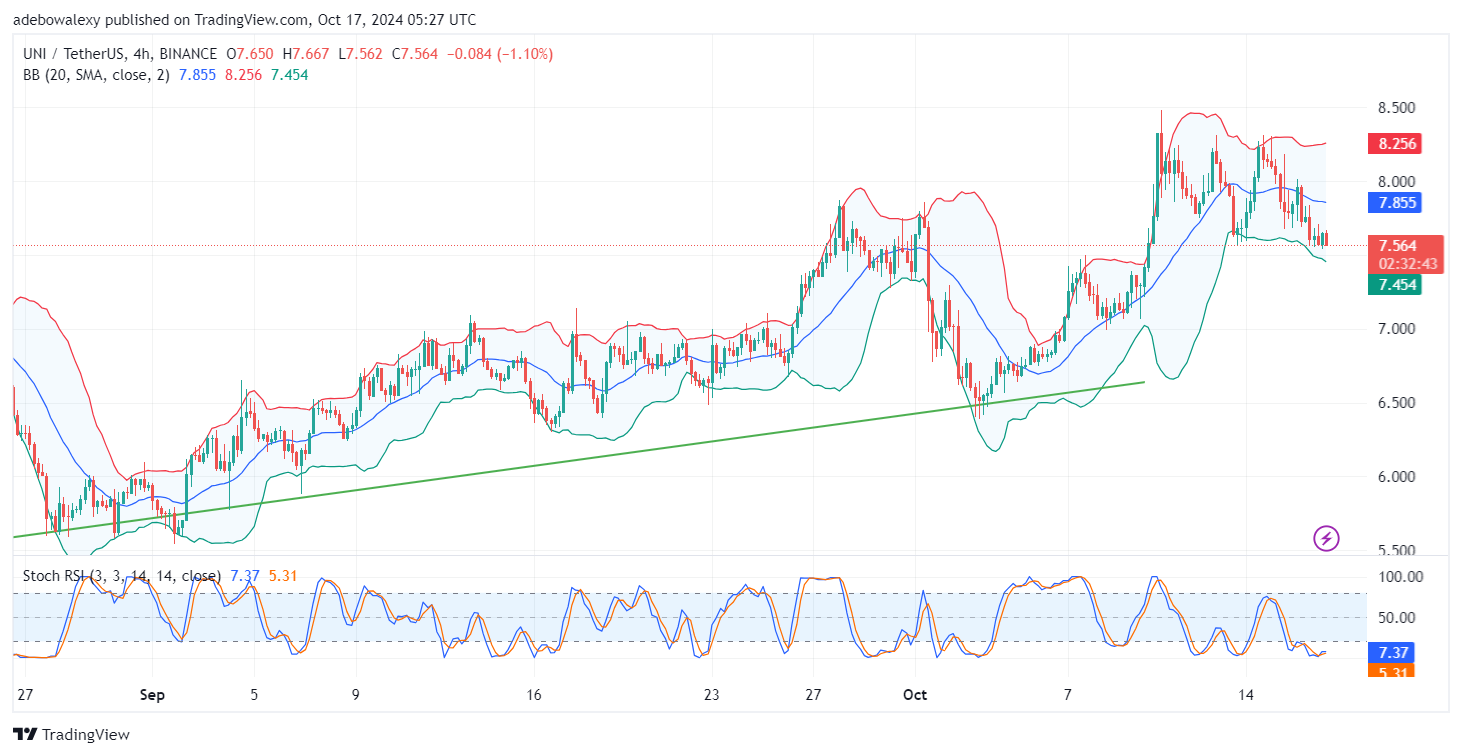
The Stochastic RSI lines are deep in the oversold region, moving sideways after a recent crossover. As a result, traders in this market may not anticipate an immediate upside rebound. The market has the potential to decline further, possibly testing the $7.50 support level. If this support fails, we could see the market drop towards the $7.00 price level.