Bitcoin (BTC) Price Prediction: BTC/USDT Continues to Struggle Below the $117,500 Mark
Estimated Reading Time: 2 minutes
Don’t invest unless you’re prepared to lose all the money you invest. This is a high-risk investment and you are unlikely to be protected if something goes wrong. Take 2 minutes to learn more

Date: September 24, 2025
Bitcoin has been struggling generally below the $120,000 price level for a while now. More recently, the market has found another medium-term resistance at $117,500. At this point, the outlook for upside movements does not look encouraging.
BTC/USDT Long-Term Trend—Bullish (Daily Chart)
Key Price Levels
Resistance: $115,000, $117,500, $120,000
Support: $112,500, $110,000, $107,500
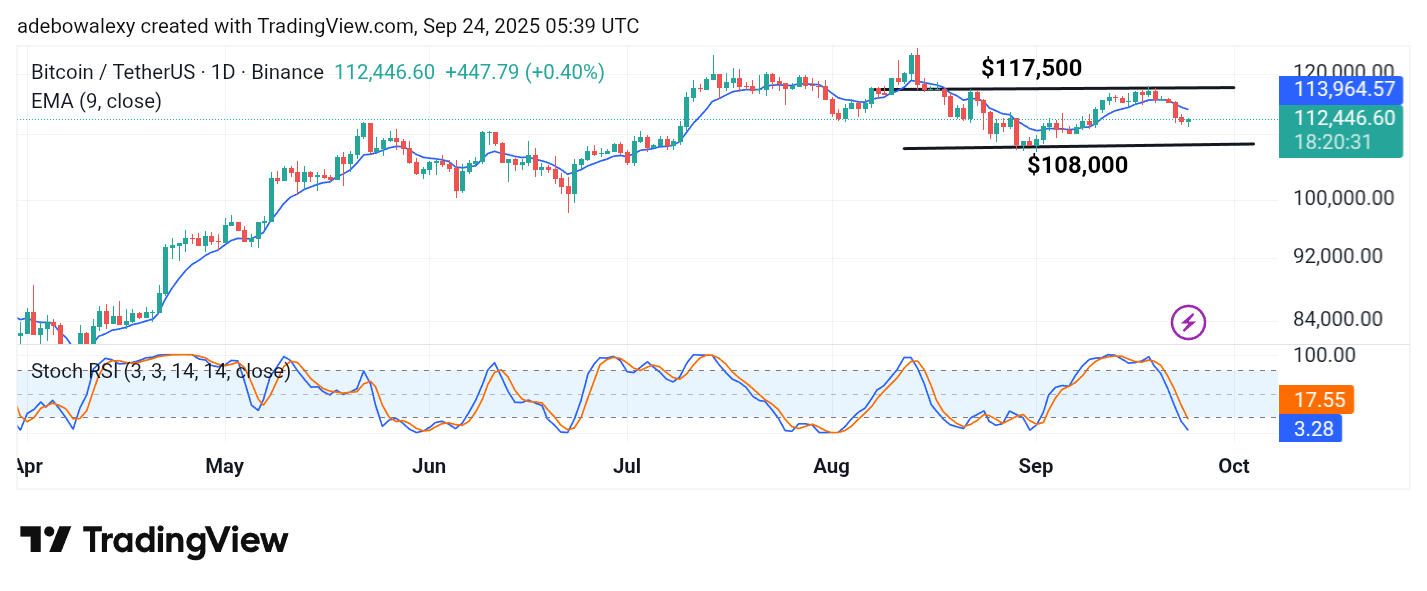
Market activity on the Bitcoin 24-hour chart is taking place below the 9-day Exponential Moving Average (EMA) line. The last two sessions sank the market notably below the 9-day EMA curve, and since then, price action has remained almost sideways. The ongoing session is bullish, represented by a green price candle. Meanwhile, the Stochastic Relative Strength Index (SRSI) indicator lines are dropping quickly into the oversold zone.
Bitcoin Price Prediction: BTC/USDT Sets a Downward Course
The impression coming from technical indicators applied to the Bitcoin daily chart suggests that donward forces are very much in control. The last price candle on the chart is green, but it has appeared significantly below the 9-day EMA curve.
The lines of the SRSI indicator are also dropping into the oversold zone. This indicates that bearish forces remain dominant. However, the movement of the SRSI lines seems somewhat exaggerated, pointing to the possibility that downward pressure may be losing strength.
Bitcoin Price Prediction: BTC/USDT Tests a Key Resistance (4-Hour Chart)
On the smaller 4-hour timeframe, Bitcoin price activity is testing a technical ceiling. Price action has been below the 9-day EMA curve for some time, but the latest price candle is green and is testing resistance at the 9-day EMA line.
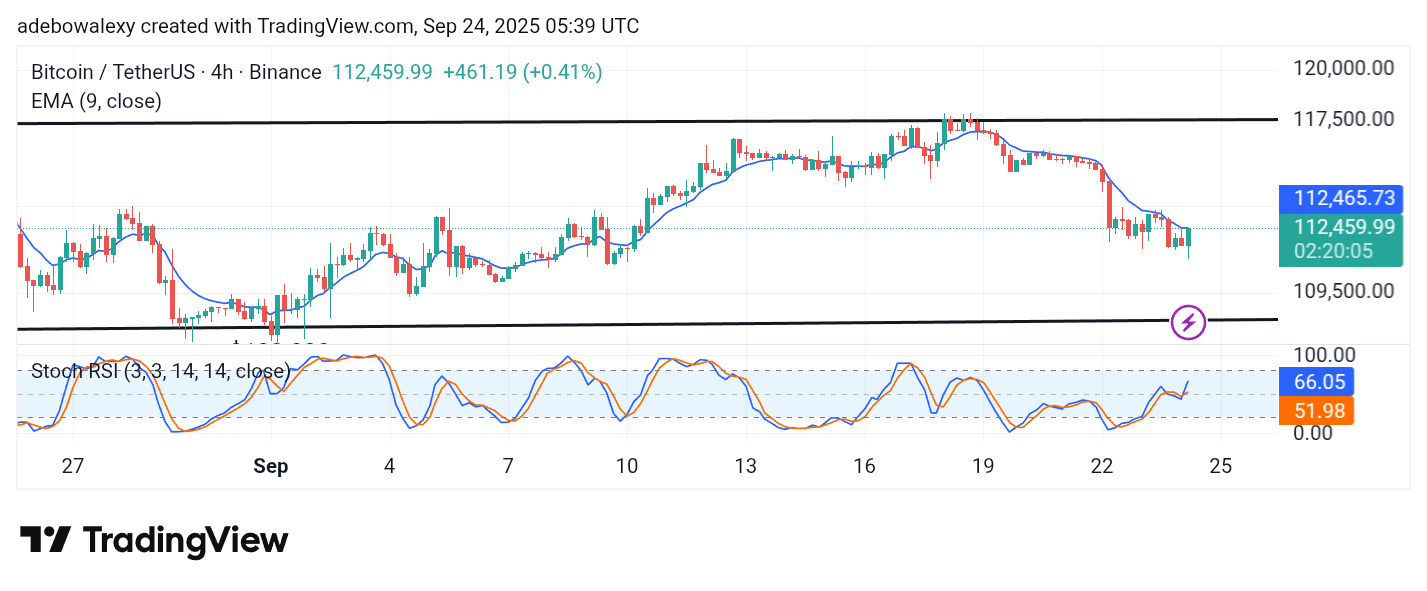
At the same time, the SRSI indicator has delivered an upward crossover above the 50 level. Consequently, this suggests that the mentioned ceiling may be breached, which could signal a short-term price increase. Therefore, traders can target the $115,000 price level.