Bitcoin (BTC) Price Prediction: BTC/USDT Heads Towards the $120K Mark
Estimated Reading Time: 3 minutes
Don’t invest unless you’re prepared to lose all the money you invest. This is a high-risk investment and you are unlikely to be protected if something goes wrong. Take 2 minutes to learn more

Date: September 17, 2025
The Bitcoin market has had its fair share of bearish activity in recent times. This brought the market below the medium-term support of the $110,000 price level. However, bulls are changing the narrative as of the latest, despite the bearish influences in the ongoing session.
BTC/USDT Long-Term Trend — Bullish (Daily Chart)
Key Price Levels
Resistance: $118,000, $120,000, $122,000
Support: $115,000, $113,000, $110,000

Trading activity as of the current session stands bearish. Nevertheless, price action keeps its base above a key technical support level. The last price candle on the chart has appeared red but floats above the 9-day Exponential Moving Average (EMA) line. Similarly, the Stochastic Relative Strength Index (SRSI) lines can be seen to have delivered an upside crossover while in the overbought region. Also, this has happened despite the appearance of the last price candle on the chart.
Bitcoin Price Prediction: BTC/USDT Stays Northward
Despite the bearish price candle that has showed up for the ongoing session, the Bitcoin market stays on a good stand. The last red price candle on the chart has appeared at the close of the previous bullish one and aloof of the 9-day EMA curve.
This technically portrays a minimal bearish effect in this market. Additionally, the SRSI indicator lines can be seen to have just delivered another upward crossover while in the overbought region. This suggests the impression that buyers are ready to push further. This will likely propel the market higher in subsequent sessions.
Bitcoin Price Prediction: BTC/USDT Stays Upward Bound (4-Hour Chart)
Coming to the Bitcoin 4-hour chart, it is discovered that bulls are making impressive progress. The ongoing session has just breached the $117,000 resistance. The last price candle on the chart stands green and bald above the 9-day EMA line.
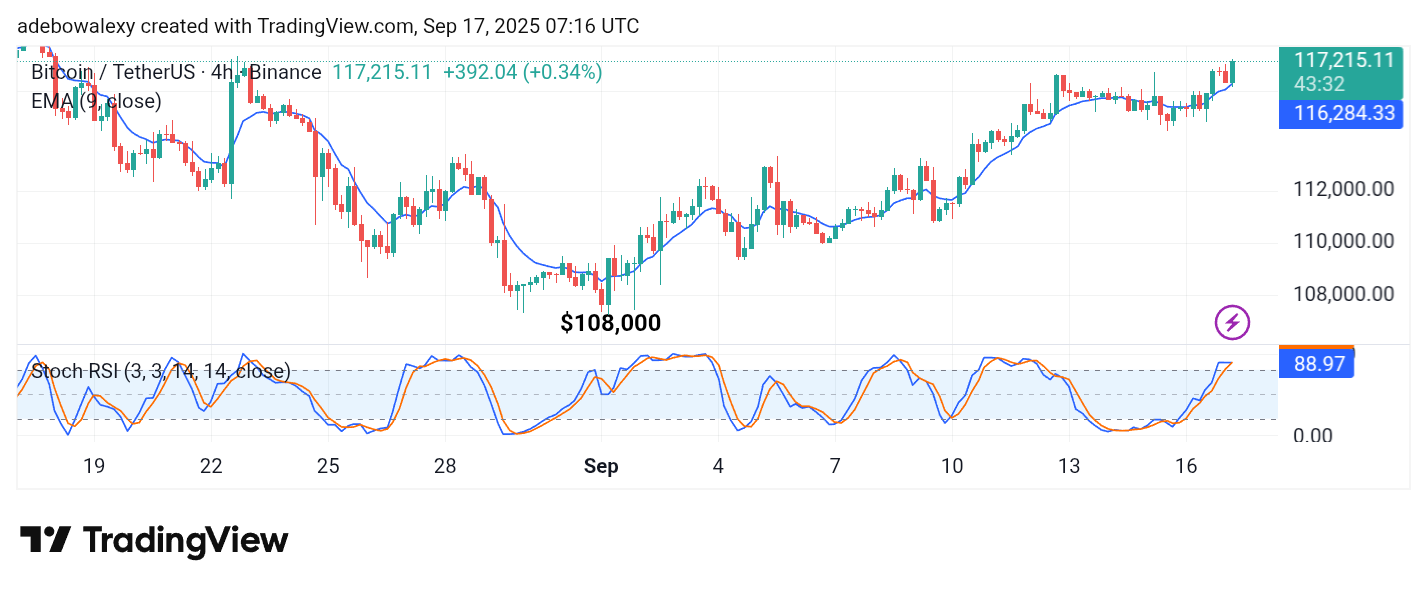
This gives the impression that upside forces are strongly in control. Likewise, the lines of the SRSI indicator keep to an upward bearing despite a convergence above the 80 threshold of the indicator. Therefore, indications align to suggest that upside forces are in the lead and may soon breach the $120,000 price level.