Bitcoin (BTC) Price Prediction: Bitcoin (BTC) Price Prediction: BTC/USDT Bulls Find It Hard to Breach the $113,000 Ceiling
Estimated Reading Time: 3 minutes
Don’t invest unless you’re prepared to lose all the money you invest. This is a high-risk investment and you are unlikely to be protected if something goes wrong. Take 2 minutes to learn more

Date: September 10, 2025
The Bitcoin market is still struggling to pick up sizeable bullish momentum. Although the market has recorded only modest gains, it continues to hover around key levels. It is crucial for the token to attract more buyers in order to move higher from here.
BTC/USDT Long-Term Trend — Bullish (Daily Chart)
Key Price Levels
Resistance: $112,500, $115,000, $117,500
Support: $110,000, $107,500, $105,000
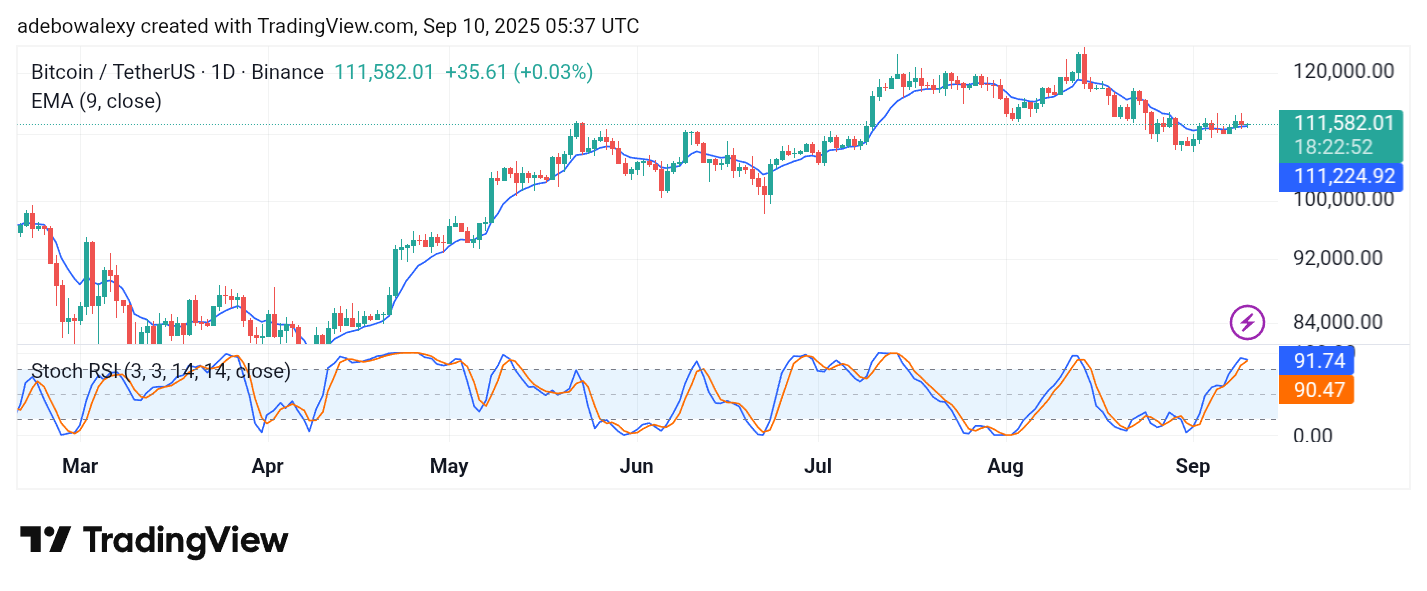
On the 24-hour chart, the Bitcoin market has started climbing upward again. The corresponding price candle for the ongoing session is a green one and sits directly above the 9-day Exponential Moving Average (EMA) line. Meanwhile, the lines of the Stochastic Relative Strength Index (SRSI) indicator have risen deep into the overbought region. The terminals of this indicator have now converged but still maintain an upward direction.
Bitcoin Price Prediction: BTC/USDT Shows Reversal Potential
While price action on the Bitcoin daily chart hasn’t managed to gain much momentum, it has at least managed to stay just above the 9-day EMA line. However, recent price candles appear quite small, reflecting only minimal movements.
The lines of the SRSI remain in the overbought region and are converged there, yet they continue a slight upward trajectory. The presence of the SRSI lines in the overbought region suggests the possibility of a pullback at this stage, especially since the market currently lacks strong bullish momentum.
Bitcoin Price Prediction: BTC/USDT Maintains a Cautious Outlook (4-Hour Chart)
Even on shorter time frames, the Bitcoin market appears weighed down by bearish sentiment. Price action here has rebounded upward only on a limited scale over the past three sessions. While the ongoing session remains bullish, the corresponding price candle still sits below the 9-day EMA curve.
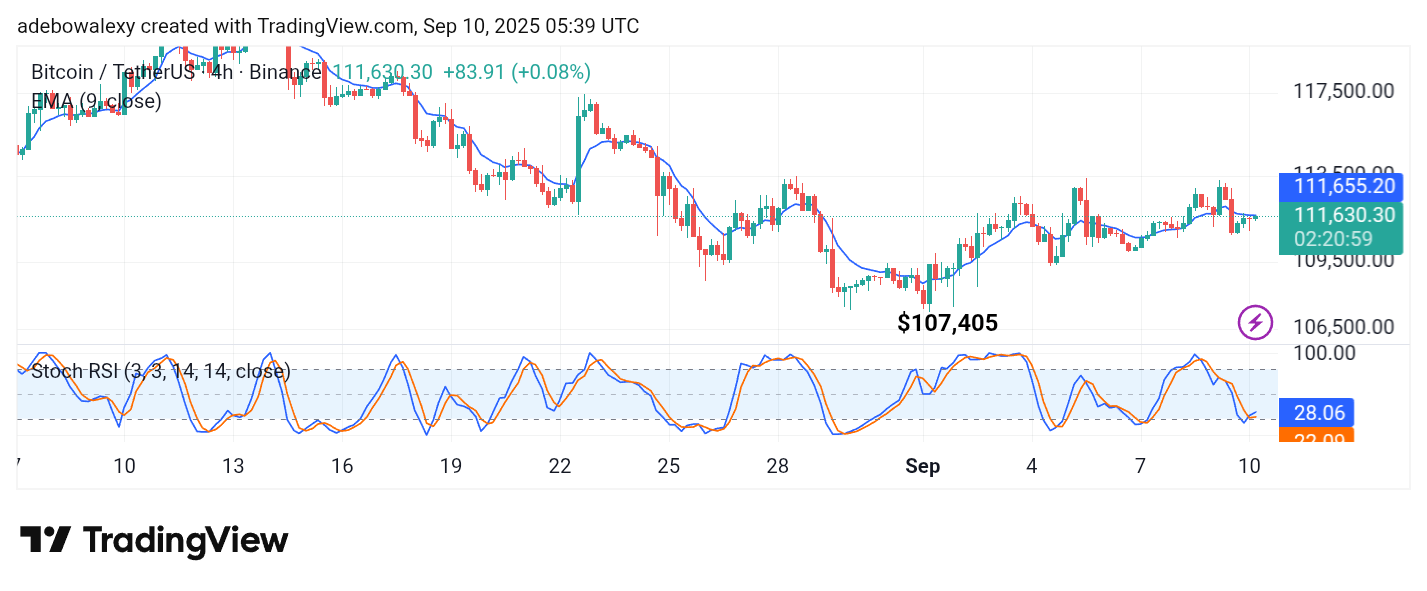
Meanwhile, the SRSI indicator line has produced an upward crossover in the oversold region. However, the fact that price action remains below the 9-day EMA line indicates that upside forces are still restrained. Nevertheless, given the upward recovery that has occurred since price action tested the $107,400 support level, traders may set their target at the $113,500 price level.