Bitcoin (BTC) Price Prediction: BTC/USDT Bounces Off the $111,000 Ceiling
Estimated Reading Time: 3 minutes
Don’t invest unless you’re prepared to lose all the money you invest. This is a high-risk investment and you are unlikely to be protected if something goes wrong. Take 2 minutes to learn more

Date: September 3, 2025
The Bitcoin market has witnessed a notable pullback over the past few weeks. Price activity retreated from the recent peak of around $120,000 to test the $109,000 baseline. The market gradually moved toward the $111,000 level in the previous session, but that point acted as resistance to further upside progress.
BTC/USDT Long-Term Trend — Bullish (Daily Chart)
Key Price Levels
Resistance: $113,000, $116,500, $119,000
Support: $110,000, $107,500, $105,000
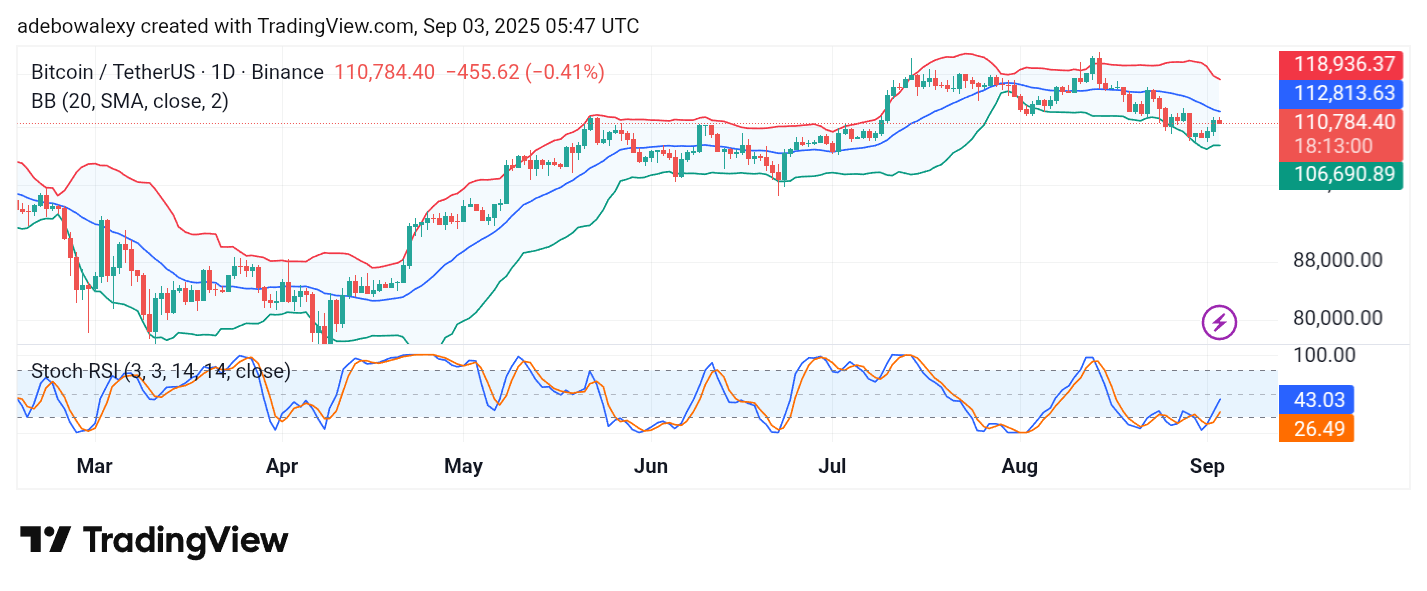
The ongoing daily session has so far appeared bearish, as shown by the current candle formation. Consequently, the price has remained below the midline of the Bollinger Bands (BB) indicator. At the same time, the Stochastic Relative Strength Index (SRSI) lines are still trending upward toward the 50 level, showing that underlying bullish momentum has not been disrupted.
Bitcoin Price Prediction: BTC/USDT Bulls Try to Keep Focus
Although the Bitcoin daily chart presently reflects bearish pressure, the last candle can be seen forming below the midline of the BB indicator. Despite this development, the SRSI lines continue to move upward toward the 50 level.
The lead line has remained ahead of the lagging line, indicating that bullish momentum retains significant strength. Therefore, buyers can still maintain their positions, as the market shows potential to recover higher in subsequent sessions.
Bitcoin Price Prediction: BTC/USDT Outlook Seems Fair (4-Hour Chart)
On the 4-hour chart, BTC/USDT has continued to hover near the upper band of the BB indicator. However, the market appears to have pulled back from that upper boundary since the previous session.
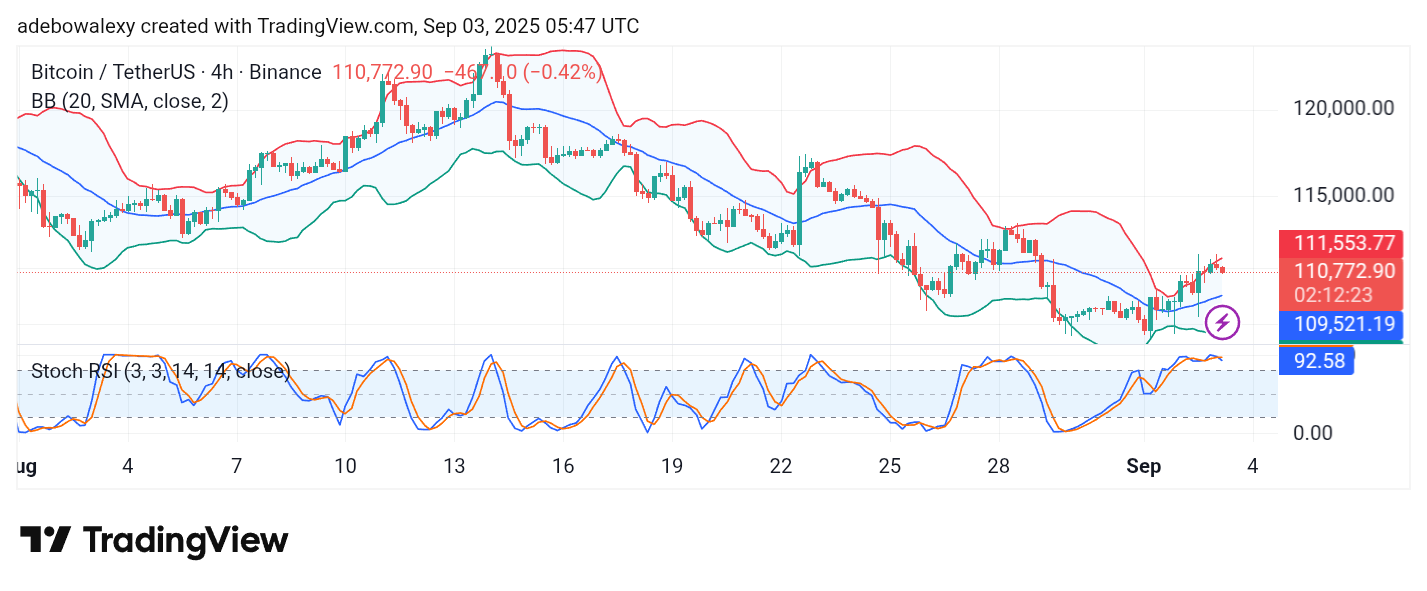
Even so, the BB indicator itself maintains a mild upward slope. The SRSI is currently positioned in the overbought region, with a bearish crossover aligning with the recent retracement.
Nevertheless, price activity is still positioned comfortably above the midline of the BB indicator. This suggests that even if the retracement extends further toward $109,521, an upward rebound remains possible. Should this occur, BTC may once again move toward the $115,000 resistance level in the near term.