Tamadoge (TAMA/USD) Bulls Regroup at $0.00066 Level
Estimated Reading Time: 3 minutes
Don’t invest unless you’re prepared to lose all the money you invest. This is a high-risk investment and you are unlikely to be protected if something goes wrong. Take 2 minutes to learn more
In the Tamadoge market, bearish pressure remains evident, with price action slipping slightly below the $0.0007 mark to trade around $0.00066. This movement signals a mildly bearish trend.
However, bullish resilience is beginning to surface, as both buying and selling forces appear to be converging within the $0.00066–$0.00067 range. This zone could become a pivotal battleground, determining the market’s next decisive move.
Key Levels to Watch
- Resistance Zones: $0.00045, $0.00050, $0.00055
- Support Zones: $0.00008, $0.00007, $0.00006
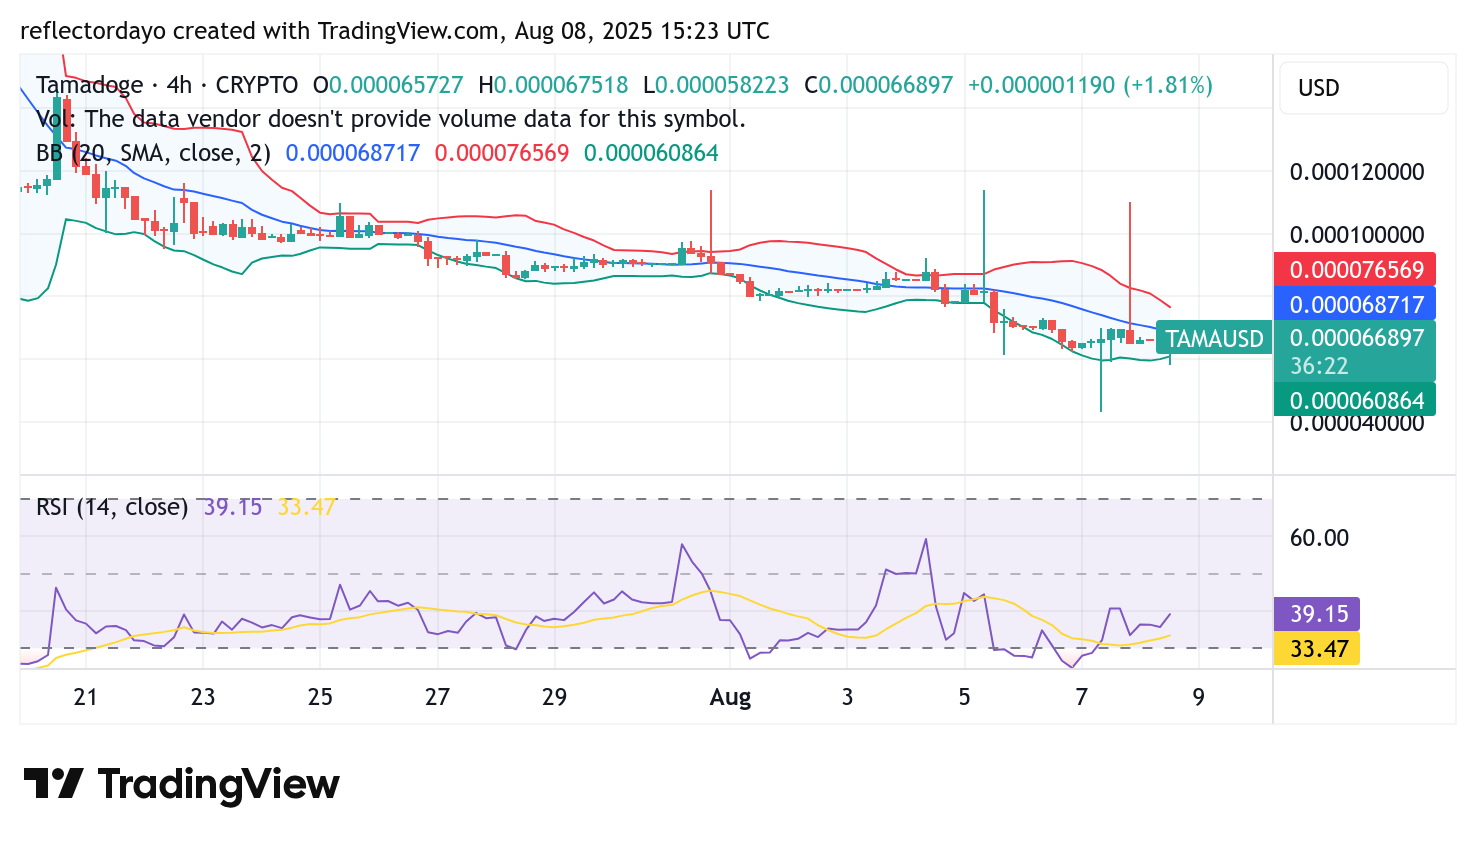
Tamadoge (TAMA/USD) 4-Hour Chart: Bears Dominate, but Signs of a Potential Rebound Emerge
Despite elevated market volatility, bullish traders have shown notable resilience, firmly defending the $0.00066 and $0.0007 support zones. This sustained buying interest has kept price action anchored around these levels, even in the face of persistent selling pressure.
The Bollinger Bands indicate a wide bandwidth, reflecting heightened volatility. However, the crypto signal remains largely confined near the $0.00066–$0.0007 range. Chart analysis further reveals repeated swings between upper and lower price zones, yet the market continues to hold steady at this critical area.
This Tamadoge price stability, despite volatility, underscores the presence of underlying bullish sentiment and hints at the possibility of an impending rebound.
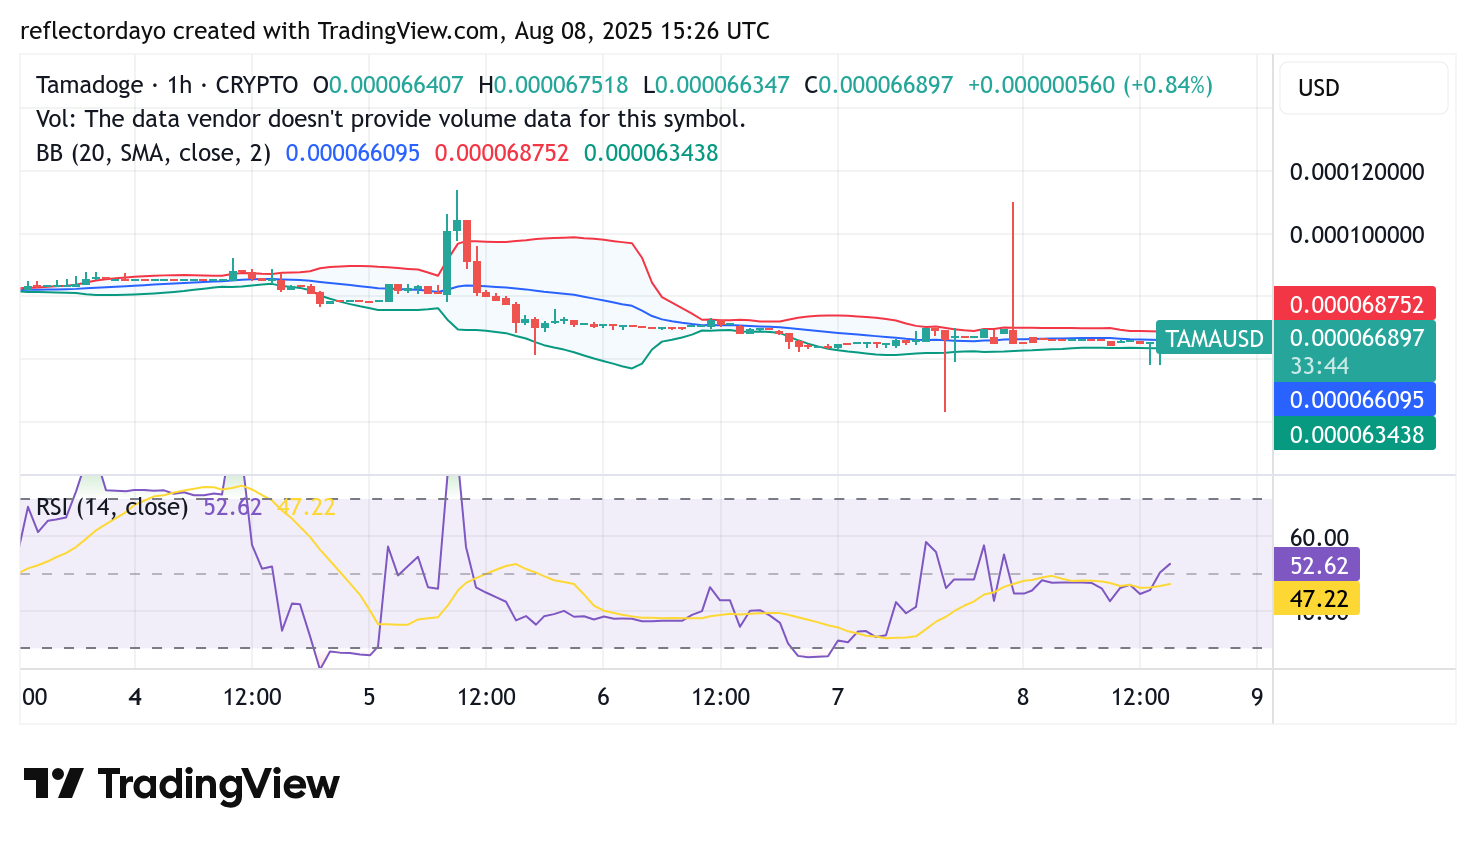
Tamadoge (TAMA/USD) 1-Hour Chart: Tight Bollinger Bands Hint at Potential Upside Break
On the 1-hour chart, Tamadoge (TAMA/USD) appears to be coiling for a decisive move, with price action holding steady around the $0.00066 mark. Volatility has noticeably eased, signaling a buildup of market tension.
Unlike the wider fluctuations visible on the 4-hour chart, the Bollinger Bands on this shorter timeframe have contracted into a narrow range—a classic precursor to a breakout. This compression indicates reduced volatility but mounting momentum, as market participants await a trigger.
Given the current structure, the bias tilts toward an upside move, with a potential rally targeting the $0.0001 region if bullish pressure takes hold. Buyers may be positioning to capitalize on the next volatility surge.
Buy TAMA/USD!
There’s no mobile runner out there quite like #TamadogePursuit! 🏃♂️
1️⃣ Sign up – start with 20 free credits for a boost!
2️⃣ Climb up the leaderboards.
3️⃣ Win $TAMA rewards!Play Now! 👇
📱Android: https://t.co/Of8SYALRzL
📱 iOS: https://t.co/IthvqovwAH pic.twitter.com/84HNqob9Rf— TAMADOGE (@Tamadogecoin) September 10, 2024