Tamadoge (TAMA/USD) Bulls Hold Firm at $0.00007 Support Amid Bearish Pressure
Estimated Reading Time: 3 minutes
Don’t invest unless you’re prepared to lose all the money you invest. This is a high-risk investment and you are unlikely to be protected if something goes wrong. Take 2 minutes to learn more
The TAMA/USD market has recently transitioned from a period of consolidation into a more defined directional movement. Following this shift, bearish forces briefly took control, causing the price to drop sharply from $0.00008 to around the $0.00007 level.
Despite heightened market volatility, bullish traders have shown resilience by firmly defending the $0.00007 support zone. This consistent rejection of bearish pressure at this key level indicates a strong bullish presence and suggests that $0.00007 may serve as a reliable foundation for potential upward momentum.
Key Levels to Watch
- Resistance Zones: $0.00045, $0.00050, $0.00055
- Support Zones: $0.00008, $0.00007, $0.00006
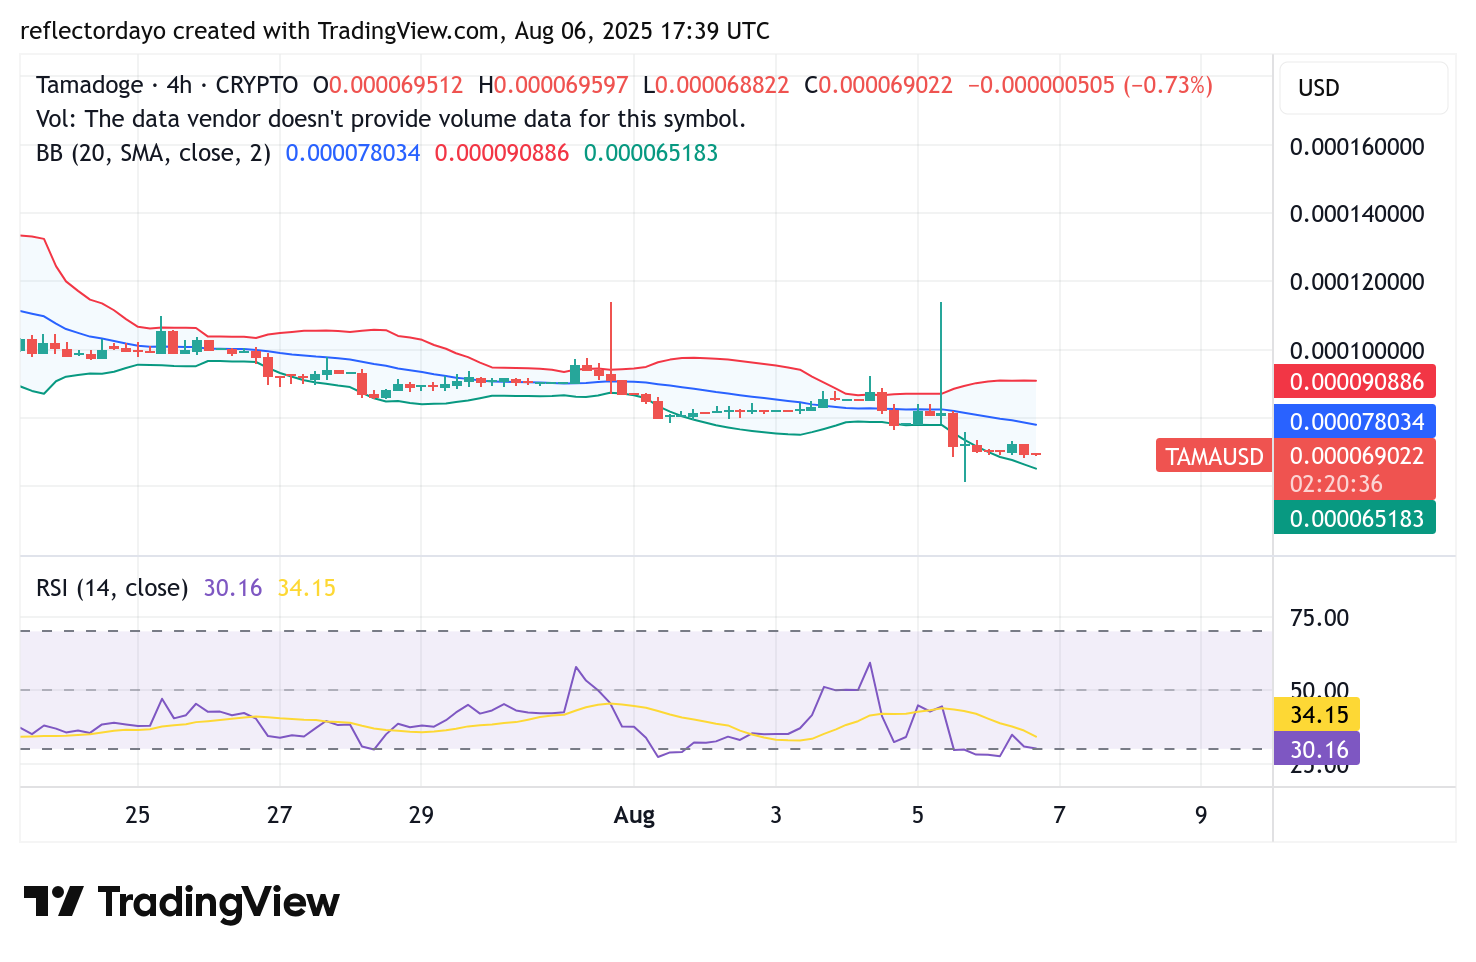
Tamadoge (TAMA/USD) 4-Hour Chart: Bears Dominate, but Signs of a Potential Rebound Emerge
The TAMA/USD market has recently exhibited pronounced bearish behavior, accompanied by heightened volatility—primarily skewed to the downside. Despite the prevailing sell pressure, bullish participants have continued to show signs of resistance at key support levels.
After a strong bearish move in the recent past, the market approached the $0.0001 price level, where momentum began to slow and traders became somewhat indecisive. This resulted in a brief phase of consolidation. However, bears eventually regained control and pushed the price further downward, breaking below the $0.0001 mark.
Now hovering around the $0.00007 level, the market is approaching oversold conditions, as reflected by key technical indicators. Traders and analysts should closely monitor this zone for a potential rebound, as a corrective move from this level would align with typical market behavior following extended downside momentum.

Tamadoge 1-Hour Chart: Bollinger Bands Signal Imminent Breakout
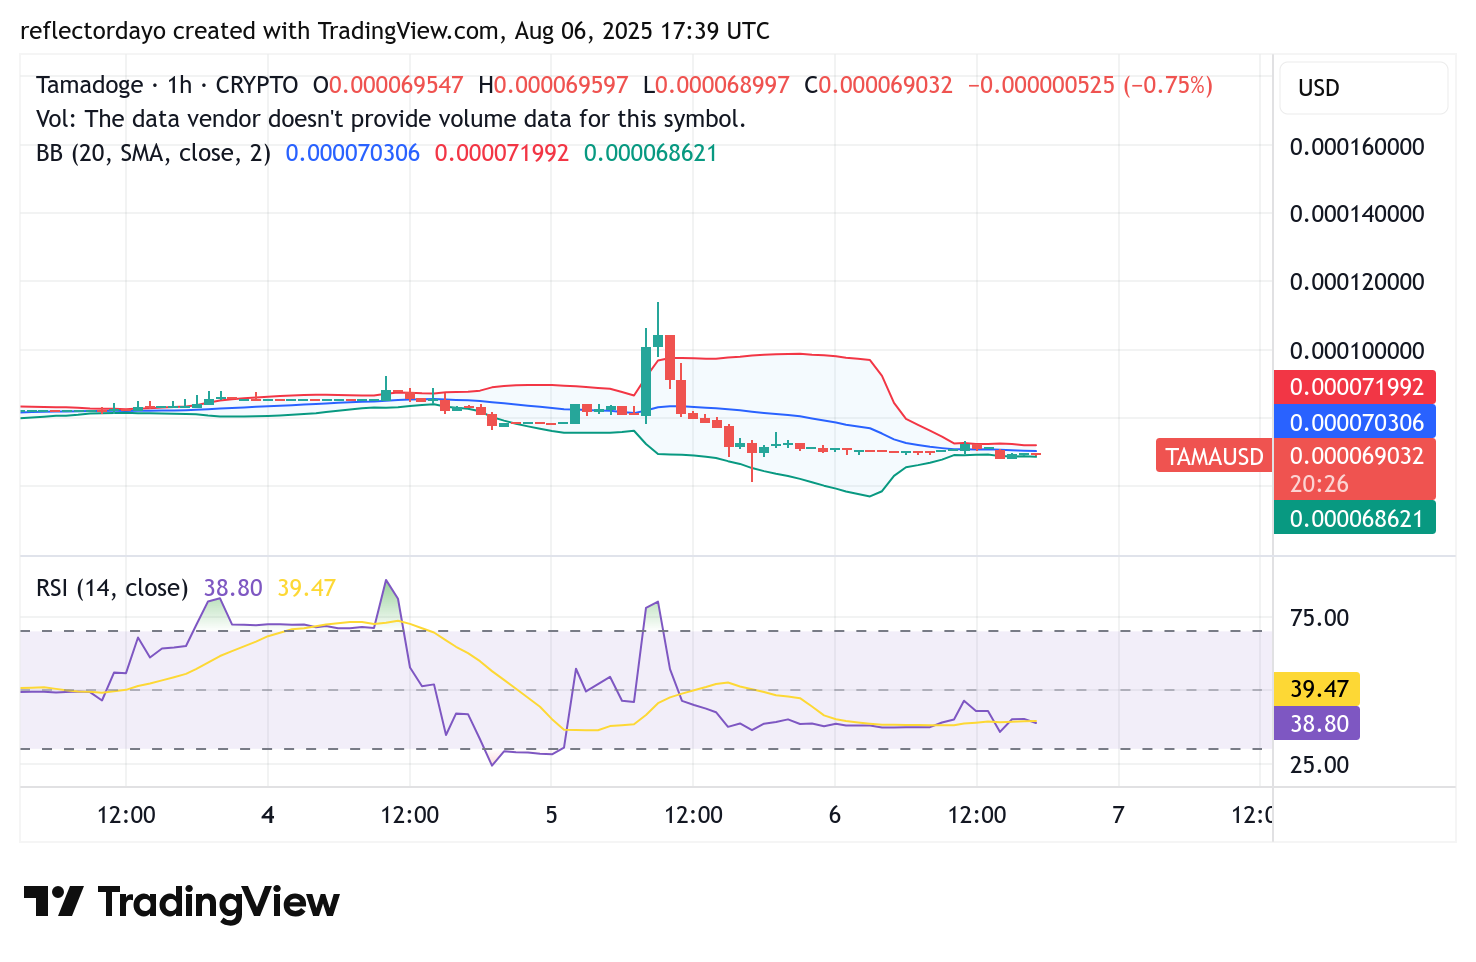
The 1-hour chart of Tamadoge (TAMA/USD) suggests that the market is positioning for a significant move. Unlike the broader divergence seen in the 4-hour chart, the Bollinger Bands on this shorter timeframe have now converged into a tight price channel—typically an indication that a breakout is imminent.
This narrowing of the bands reflects reduced volatility and building pressure, often preceding a decisive price movement. In this context, the setup leans toward a potential bullish breakout, with price likely to rally toward the $0.0001 level as buyers look to exploit the anticipated volatility surge.
Buy Tamadoge!
There’s no mobile runner out there quite like #TamadogePursuit! 🏃♂️
1️⃣ Sign up – start with 20 free credits for a boost!
2️⃣ Climb up the leaderboards.
3️⃣ Win $TAMA rewards!Play Now! 👇
📱Android: https://t.co/Of8SYALRzL
📱 iOS: https://t.co/IthvqovwAH pic.twitter.com/84HNqob9Rf— TAMADOGE (@Tamadogecoin) September 10, 2024