Tamadoge (TAMA/USD) Market Poised for Reversal Amid Bearish Exhaustion
Estimated Reading Time: 3 minutes
Don’t invest unless you’re prepared to lose all the money you invest. This is a high-risk investment and you are unlikely to be protected if something goes wrong. Take 2 minutes to learn more

The battle for dominance between buyers and sellers continues in the Tamadoge market. Recently, the bears gained temporary control, driving the price down to approximately $0.00008. However, signs of bearish exhaustion are now emerging around this level, suggesting that the market may be primed for a significant rebound.
Although traders remain cautious about entering long positions, the downward momentum appears to be weakening. If current conditions persist, a bullish reversal could be on the horizon.
Key Levels to Watch
- Resistance Zones: $0.00045, $0.00050, $0.00055
- Support Zones: $0.00008, $0.00007, $0.00006
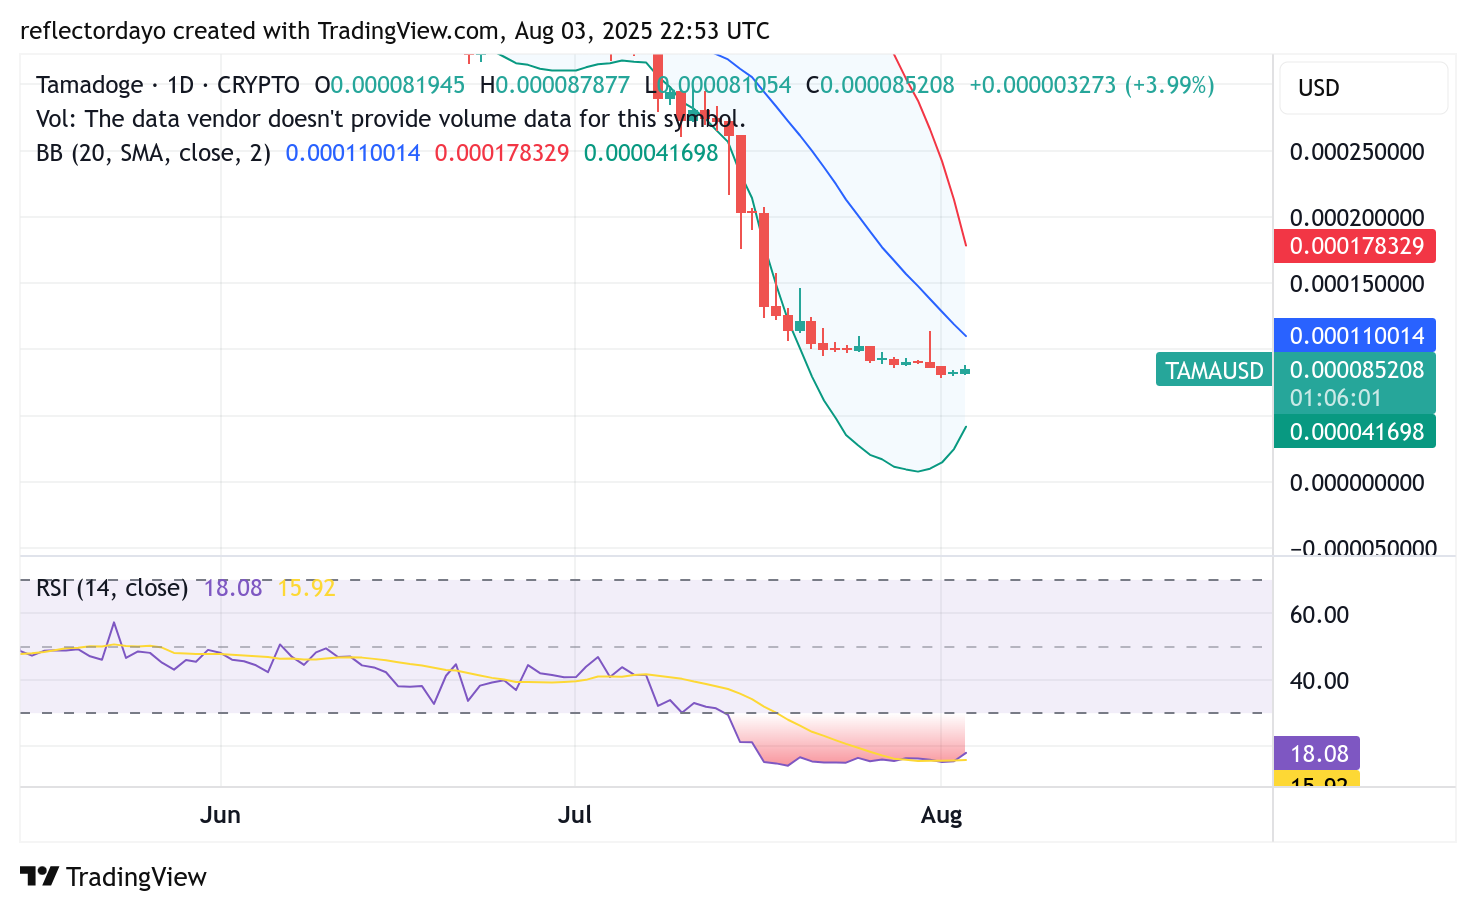
Tamadoge (TAMA/USD) Daily Chart: Bullish Resilience Emerging Amid Continued Consolidation
Technical indicators suggest that the Tamadoge market is primed for a potential rebound. Notably, the Relative Strength Index (RSI) has been hovering around the 18 level—deep in oversold territory—signaling bearish exhaustion.
In response, the market has already shown signs of life, with a modest bounce pushing the price up to approximately $0.000085. Given this RSI reading, traders may be encouraged to consider long positions, as selling momentum appears to be weakening and the potential for a bullish reversal grows.
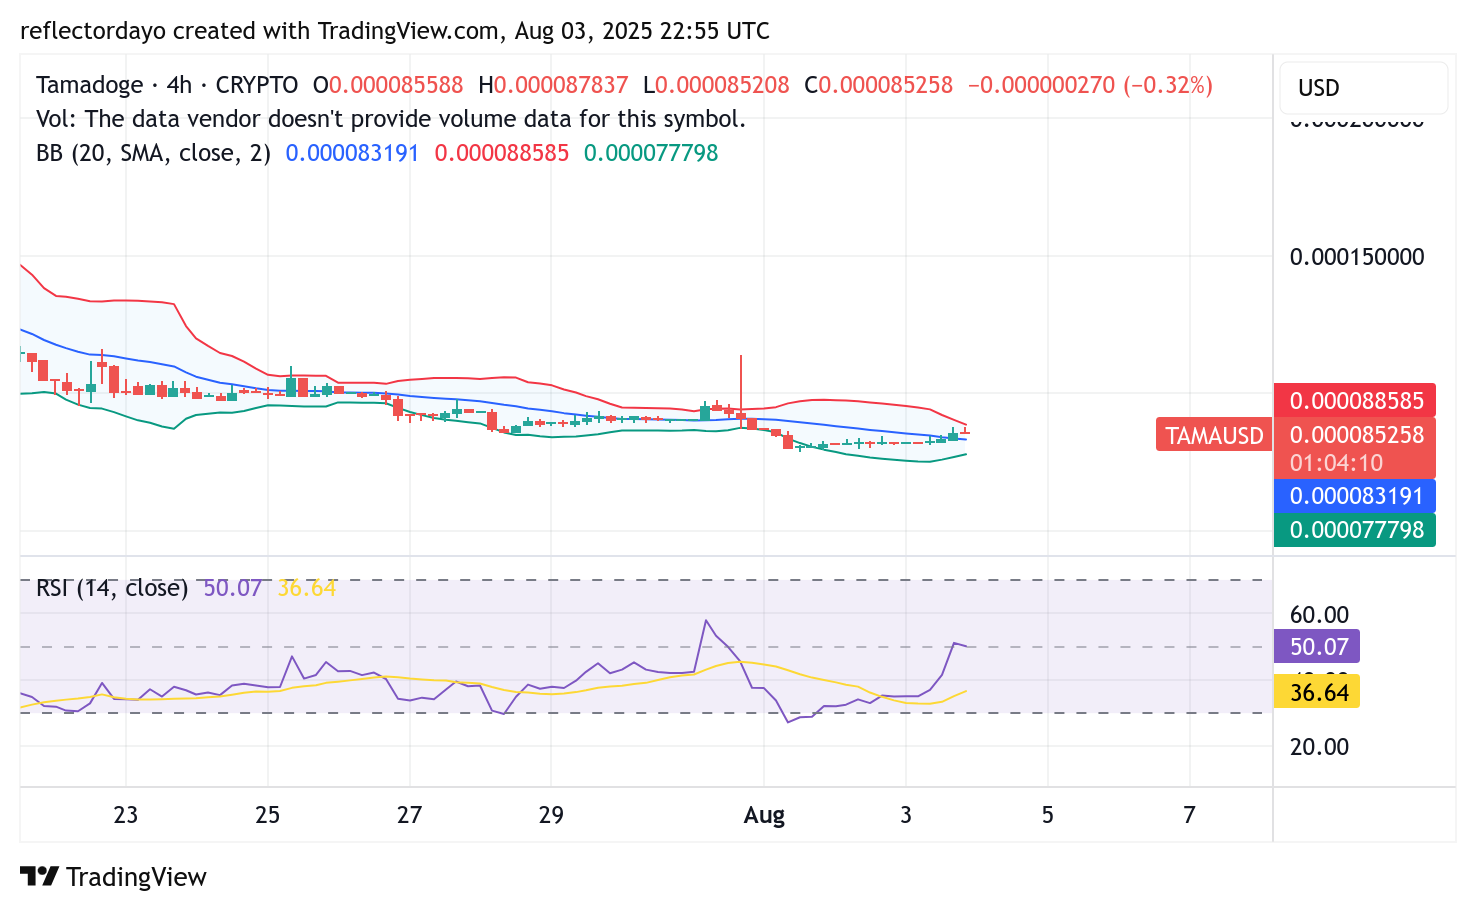
Tamadoge (TAMA/USD) 4-Hour Chart: Early Momentum Signals Emerge Amid Ongoing Stalemate
On the 4-hour chart, the Tamadoge market is currently exhibiting equilibrium, with price action consolidating around the $0.000085 level. This balance is reflected in the Relative Strength Index (RSI), which hovers near the midpoint—indicating a neutral stance between buying and selling pressures.
If the current equilibrium persists, the market may continue its sideways movement in the short term. However, a potential breakout in the crypto signal toward the $0.0001 level remains on the horizon should bullish momentum begin to build.
Buy TAMA/USD!
There’s no mobile runner out there quite like #TamadogePursuit! 🏃♂️
1️⃣ Sign up – start with 20 free credits for a boost!
2️⃣ Climb up the leaderboards.
3️⃣ Win $TAMA rewards!Play Now! 👇
📱Android: https://t.co/Of8SYALRzL
📱 iOS: https://t.co/IthvqovwAH pic.twitter.com/84HNqob9Rf— TAMADOGE (@Tamadogecoin) September 10, 2024