Ethereum (ETH/USD) Price Rallies Closely at $2000
Estimated Reading Time: 3 minutes
Don’t invest unless you’re prepared to lose all the money you invest. This is a high-risk investment and you are unlikely to be protected if something goes wrong. Take 2 minutes to learn more
Ethereum Price Prediction – June 28
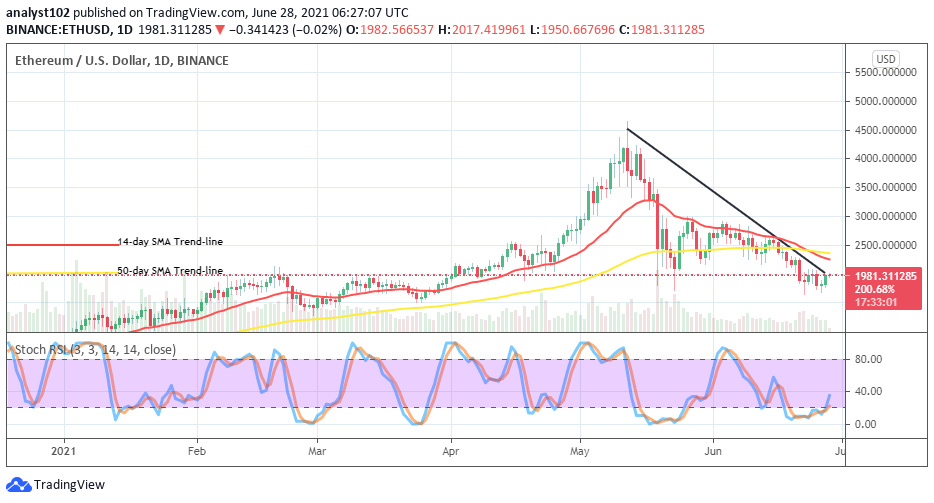
Another round of price rallies has been taking place in the market operation of ETH/USD presently. In the last couple of trading days’ sessions, the crypto’s value downsized close to the tune of $1,600 or thereabout before it started the current regaining moving effort to trade around the level of $1,979 at a percent rate of -0.12.
ETH/USD Market
Key Levels:
Resistance levels: $2,300, $2,800, $3,300
Support levels: $1,600, $1,400, $1,200
ETH/USD – Daily Char
On several trading days’ occasions, it has shown on the ETH/USD daily chart that levels underneath the line of $2,000 have been major zones where the crypto has to find strong support before it could regain lost momentum. Presently, a bullish candlestick is in the forming against the key point earlier mentioned. The 50-day SMA trend-line has intercepted southward as the bearish trend-line drew across them downwardly to place also on the level mentioned earlier. The Stochastic Oscillators stylishly slanted to the north by swerving the lines toward range 40. That suggests that an upward force is gathering in the crypto economy.
Will the ETH/USD market lose momentum at the $2,000 level?
The point that could pose a difficult line to the current price rallying efforts that the ETH/USD market has embarked upon is at the $2,000 level. In the meantime, it’s also worthy of noting that the lower value of $1,500 has appeared to be the last maximum point that the US currency could push in lowering the crypto’s valuation. In other words, it means that; bulls and intending investors may re-consider joining the market to the upside especially, while a rallying move is at an early stage.
On the downside, the crypto’s value will have to be around the value of $2,000. And, it appears that the path to the south is at the point. The interception of the 50-day SMA indicator by the 14-day SMA trend-line has portended that the downward force is still much in place. 
ETH/BTC Price Analysis
In comparison, Ethereum has not been able to regain the position pairing with Bitcoin. The base crypto’s trending capacity is in the correctional-moving mood. The 50-day SMA indicator is below the 14-day SMA trend-line. The bullish trend-line is a supportive indicator of the bigger SMA. The bullish trend-line is a supportive indicator to the bigger SMA. The Stochastic Oscillators are in the oversold region, trying to cross the lines northbound at range 20. That signifies that the base crypto is preparing the stance to regain the energy from the counter crypto.
Note: new.cryptosignals.org is not a financial advisor. Do your research before investing your funds in any financial asset or presented product or event. We are not responsible for your investing results.
You can purchase crypto coins here. Buy Tokens