Battle Infinity Market Forecast: IBAT Draws Strength From the $0.0067110 Demand Level
Estimated Reading Time: 3 minutes
Don’t invest unless you’re prepared to lose all the money you invest. This is a high-risk investment and you are unlikely to be protected if something goes wrong. Take 2 minutes to learn more

Free Crypto Signals Channel
Battle Infinity Market Forecast – August 22
Battle Infinity market forecast is for the market to surge towards the $0.0115370 resistance level after it draws strength from the $0.0067110 demand level.
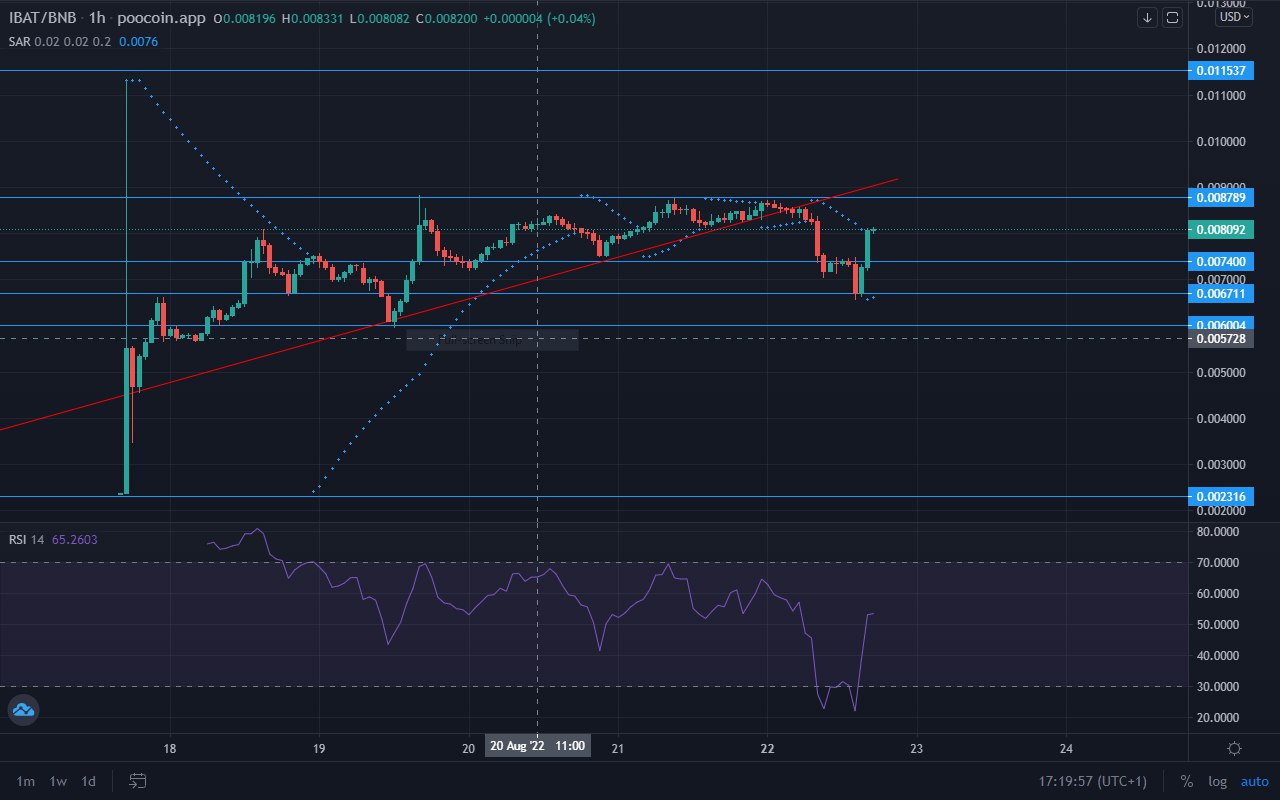
IBAT/USD Long-Term Trend: Bullish (1-Hour Chart)
Key Levels:
Supply Zones: $0.0115370, $0.0087890
Demand Zones: $0.0074000, $0.0067110
IBAT remains strongly bullish. However, the coin has reached a major resistance level at $0.0087890 following the first liquidity rush. As a result, the market has resorted to sideways movement from the 19th till date. Finally, to break the jinx, the coin has pulled back to draw strength from the $0.0067110 demand level. Battle Infinity is not expected to spring toward the resistance level to break it.
Battle Infinity Market Forecast: IBAT Is Strongly Bullish
Battle Infinity has been bulldozing its way upward due to its very strong bullish orientation since the inception of the coin. However, the coin meets a major barrier at $0.0087890.
The market goes into a ranging movement to find zones of weakness in the supply line. After ranging for more than two days, the buyers have decided to take the approach of a forceful drive against the resistance.
IBAT pulled back to strong demand to draw strength and is now driving upwards. The RSI (Relative Strength Index) indicator line has turned sharply upward and has climbed to the bullish region of the chart.
IBAT/USD Medium-Term Trend: Bullish (15-minute chart)
The 15-minute chart shows clearly the price climbing up a trend line. The trend line initially formed an ascending triangle with the $0.0087890 resistance level. The formation was intended to lead the market to an upsurge beyond the resistance level. But $0.0087890 remains impenetrable and the price drops instead.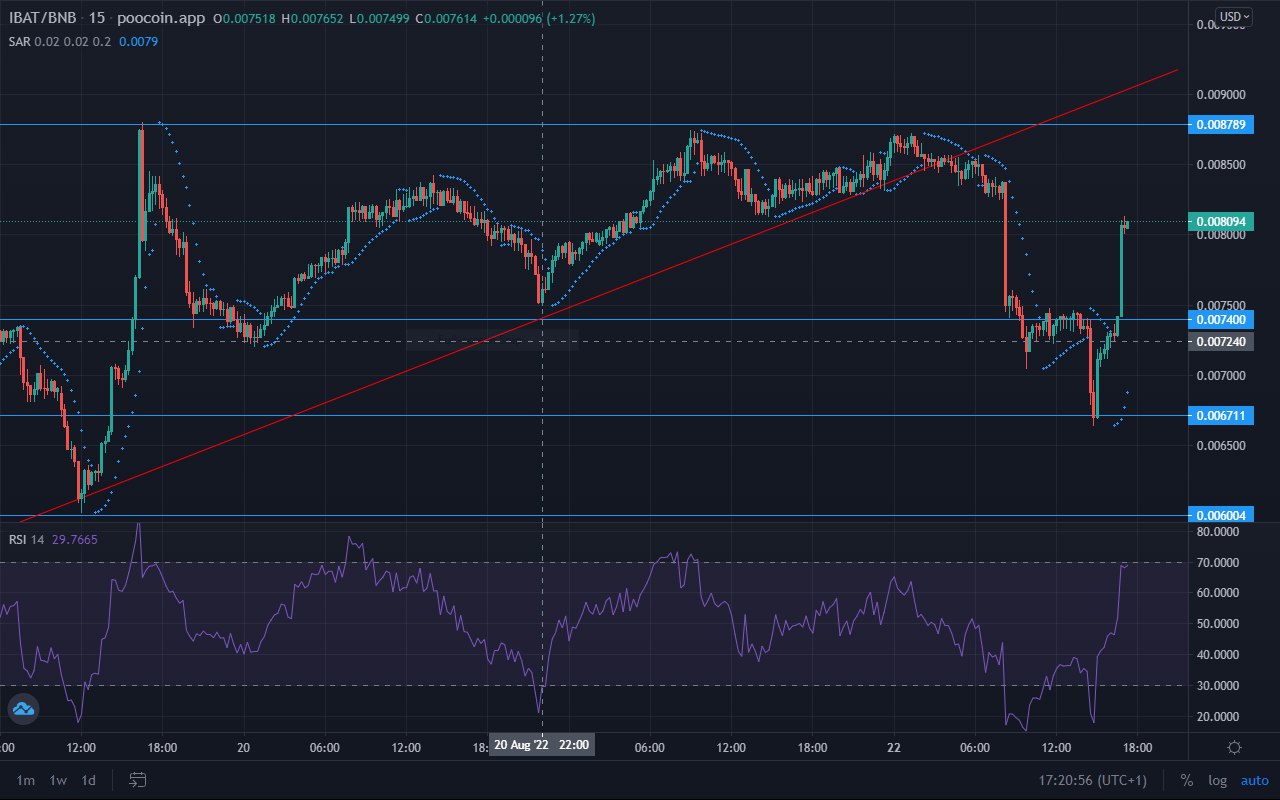
The bulls are using this outcome to their advantage. The price drops further to a strong support level at $0.0067110 to draw strength. The RSI line has risen to the overbought border. The bulls have now been unleashed and we can expect IBAT to break the $0.0087890 resistance level and rise towards the $0.0115370 key level.
Battle Infinity has huge potential for unusually massive returns. Buy IBAT
Note: Cryptosignals.org is not a financial advisor. Do your research before investing your funds in any financial asset or presented product or event. We are not responsible for your investing results.