Quant Price Prediction: QNT/USD Ranges Around $115.7 Level
Estimated Reading Time: 3 minutes
Don’t invest unless you’re prepared to lose all the money you invest. This is a high-risk investment and you are unlikely to be protected if something goes wrong. Take 2 minutes to learn more
Quant Price Prediction – January 10
The Quant price prediction reveals that QNT drops to touch the daily low of $112.3 as the price dips for new buyers to surface.
QNT/USD Medium-term Trend: Ranging (1D Chart)
Key Levels:
Resistance levels: $145, $150, $155
Support levels: $85, $80, $75
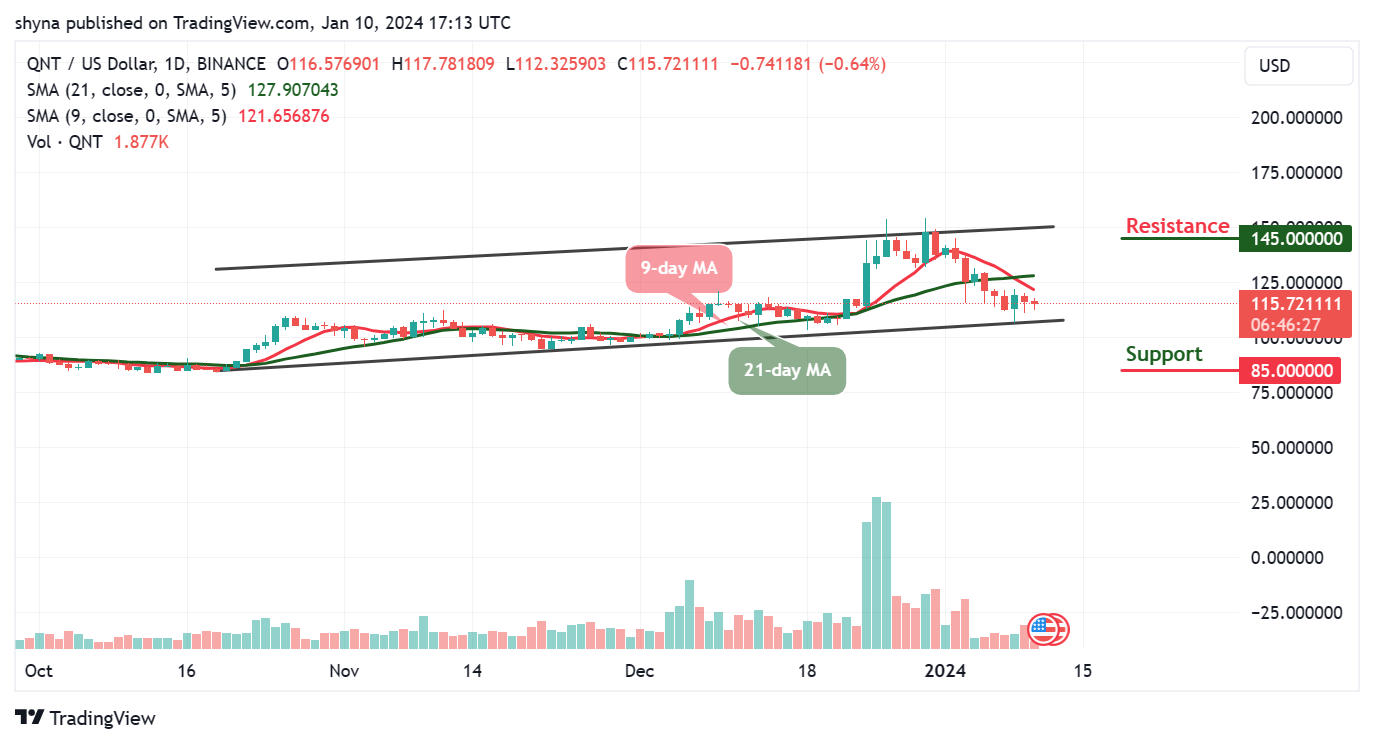
QNT/USD is currently trading below the 9-day and 21-day moving averages, positioned at $115.7. Meanwhile, based on the chart analysis, sellers appear to be exerting pressure, pushing the coin in a downward direction. This scenario may present an opportunity for new buyers to enter the market while existing buyers are anticipated to capitalize on buying opportunities during price declines.
Quant Price Prediction: QNT Price Could Retreat to Move Higher
The Quant price appears to be trading sideways, potentially paving the way for sellers to take control of the market. Additionally, a bearish signal is indicated as the 9-day moving average descends below the 21-day moving average. If the downtrend continues, key support levels to watch for are at $85, $80, and $75 respectively.
Conversely, if buyers manage to maintain the current support level around $115.7 and drive the price upward, they could encounter immediate resistance at $125. Further bullish momentum towards the upper boundary of the channel could face the resistance levels at $145, $150, and $155 respectively.
QNT/USD Medium-term Trend: Bearish (4H Chart)
On the 4-hour chart, the price of Quant is currently fluctuating between the 9-day and 21-day moving averages. A surge in buying pressure from bulls could propel the price upward. Conversely, if the coin descends toward the lower boundary of the channel, buyers are anticipated to capitalize on the dip, potentially igniting another bullish trend.
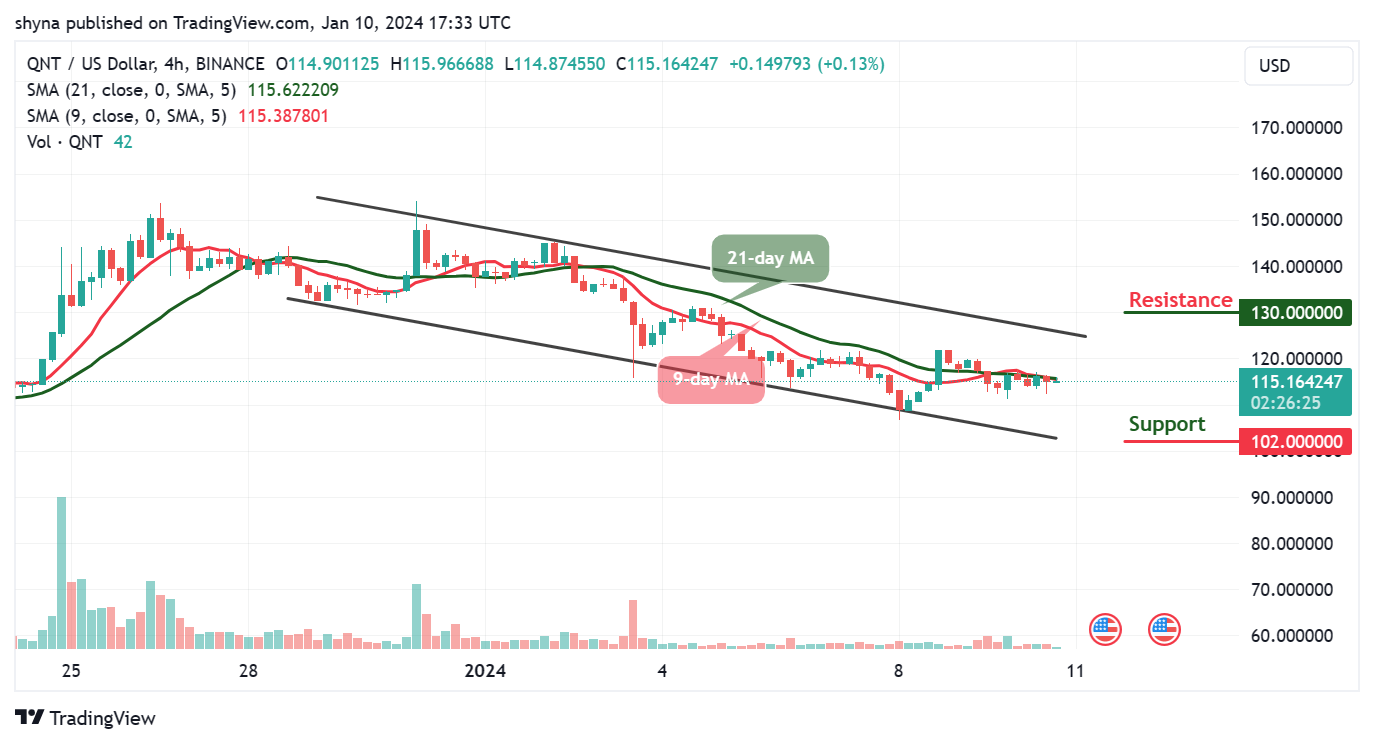
In the event that buyers successfully push the price beyond the channel’s upper boundary, they may encounter resistance levels around $130 and beyond. On the contrary, if the coin retraces and moves downward, support levels could emerge around $102 and below. Additionally, a scenario where the 9-day moving average surpasses the 21-day moving average could set the stage for an upward trajectory in the Quant price.
Place winning Quant trades with us. Get QNT here