Cardano (ADA) Rebounds above $1.33 Support, May Face Rejection at $1.500 High
Estimated Reading Time: 2 minutes
Don’t invest unless you’re prepared to lose all the money you invest. This is a high-risk investment and you are unlikely to be protected if something goes wrong. Take 2 minutes to learn more

Cardano (ADA) Long-Term Analysis: Bearish
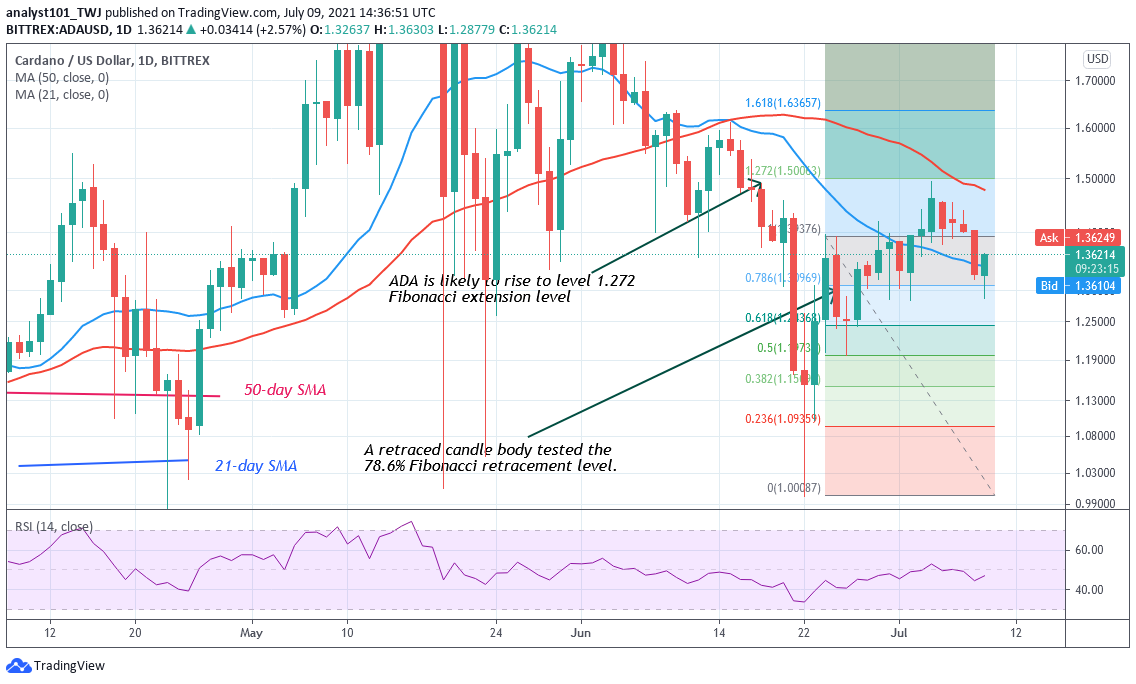
Following a rebound above the previous low at $1.03, ADA price has been making positive moves. The upward correction reached the high of $1.50 but was resisted. The coin fell to $1.30 low and resumed an upward move. Meanwhile, on June 24 uptrend; a retraced candle body tested the 78.6% Fibonacci retracement level. The retracement indicates that ADA is likely to rise to level 1.272 Fibonacci extension or level $1.500 and reverse. According to the Fibonacci tool when ADA reverses, it will return to 78.6% Fibonacci retracement level. From the price action, ADA has tested the Fibonacci level.
Cardano (ADA) Indicator Analysis
Cardano has fallen to level 47 of the Relative Strength Index period 14. It indicates that ADA is in the downtrend zone and below the centerline 50. The 21-day SMA and the 50-day SMA are sloping horizontally indicating the sideways move. ADA is above the 40% range of the daily stochastic. It indicates that ADA is in a bullish momentum.

Technical indicators:
Major supply zones: $2.0, $2.20, $2.40
Major demand zones: $1.40, $1.20, $1.00
What Is the Next Direction for Cardano (ADA)?
Cardano has resumed a fresh upward move after the resistance at $1.500. The Fibonacci tool has indicated a further upward move on the 4-hour chart. On July 4 uptrend; a retraced candle body tested the 50% Fibonacci retracement. The retracement indicates that ADA is likely to rise to level 2.0 Fibonacci extension or level $1.70. From the price action, Cardano is approaching the high of $1.36.

You can purchase crypto coins here. Buy Tokens
Note: new.cryptosignals.org is not a financial advisor. Do your research before investing your funds in any financial asset or presented product or event. We are not responsible for your investing results