Tamadoge (TAMA/USD) Shows Signs of Accumulation Around the $0.00009 Price Level
Estimated Reading Time: 3 minutes
Don’t invest unless you’re prepared to lose all the money you invest. This is a high-risk investment and you are unlikely to be protected if something goes wrong. Take 2 minutes to learn more
The Tamadoge (TAMA/USD) market continues to exhibit a prolonged phase of consolidation around the $0.00009 price level. This sideways movement follows a significant downtrend that began near the $0.0005 mark, with the price gradually declining and settling within the $0.00009–$0.0001 range over the past several weeks.
While bullish momentum has yet to clearly assert itself, the persistent defense of this support zone suggests that bearish pressure may be weakening. Although upward movement remains limited for now, the ongoing consolidation could indicate accumulation—an early signal that a potential trend reversal may be forming beneath the surface.
Key Levels to Watch
- Resistance Zones: $0.00045, $0.00050, $0.00055
- Support Zones: $0.00009, $0.00008, $0.00007
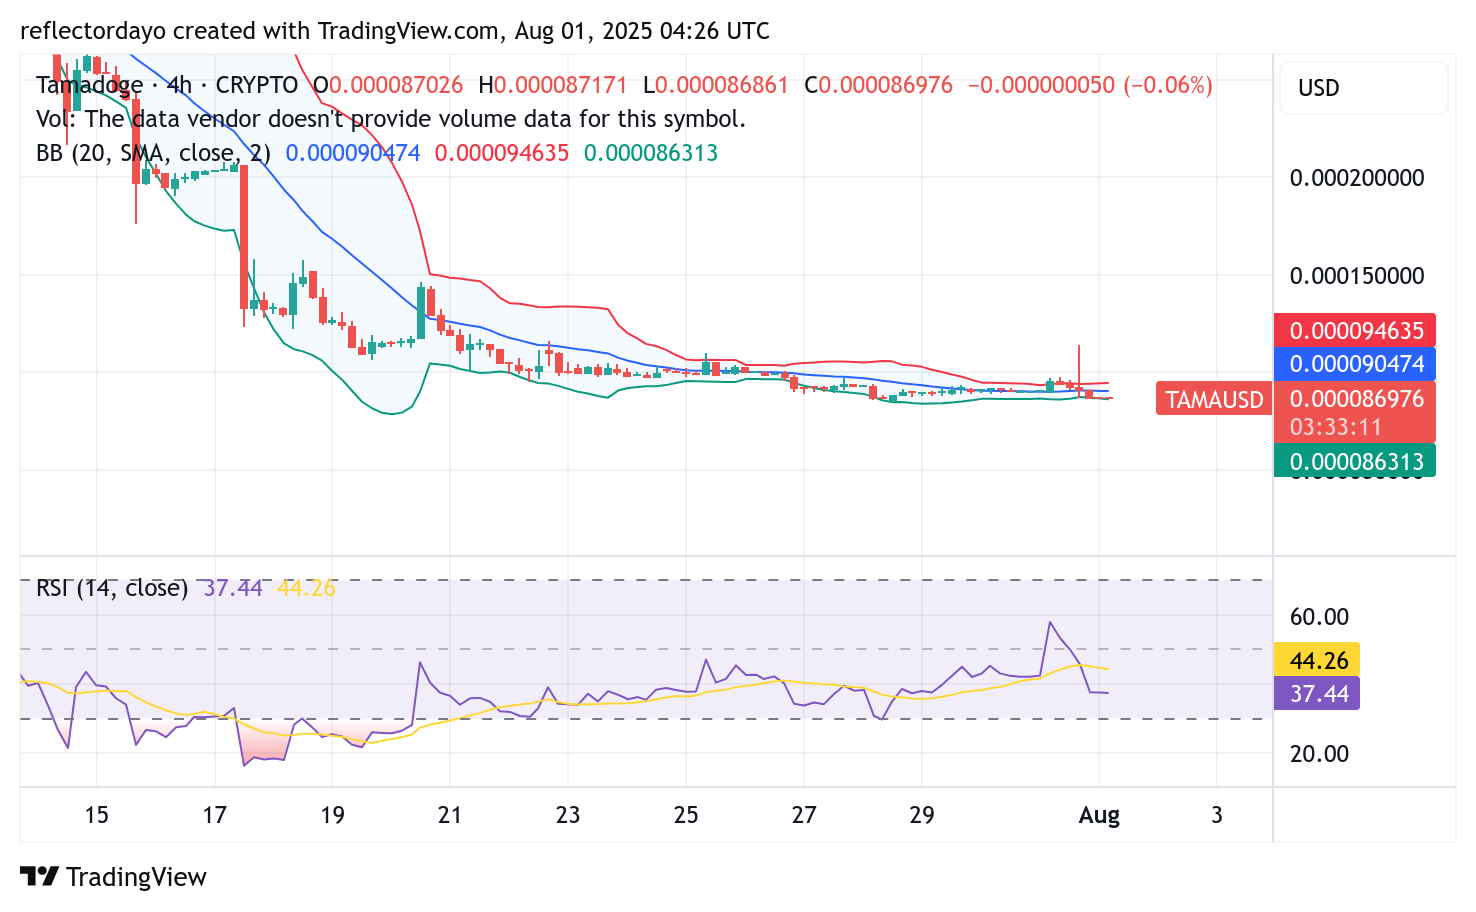
Tamadoge 4-Hour Chart: Bullish Resilience Emerging Amid Continued Consolidation
The ongoing consolidation around the $0.00009 level suggests that bearish momentum is beginning to wane, following a period of aggressive downward pressure in recent sessions. While bullish sentiment has yet to assert a clear reversal, the current price behavior reflects a possible equilibrium between buyers and sellers.
Rather than viewing the lack of upward movement in the TAMA/USD market as weakness, it may indicate that bulls are quietly accumulating positions in anticipation of a breakout. With both sides appearing evenly matched, this consolidation phase could present a strategic “buy-the-dip” opportunity for forward-looking investors aiming to position ahead of the next potential upswing.
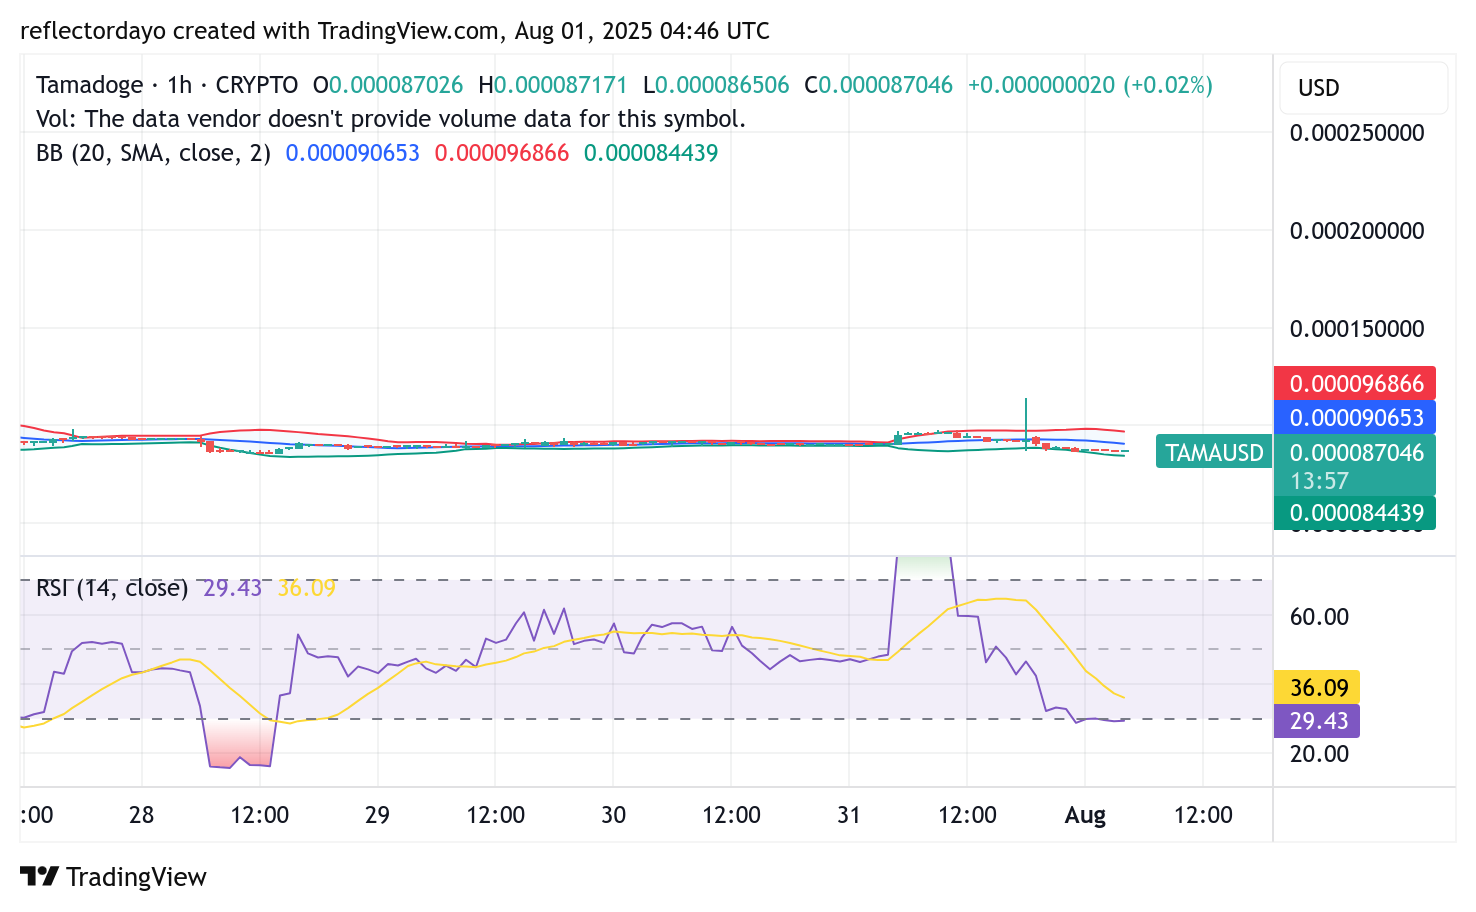
Tamadoge (TAMA/USD) 1-Hour Chart: Early Momentum Signals Emerge Amid Ongoing Stalemate
The 1-hour chart of Tamadoge (TAMA/USD) reveals early signs of potential bullish momentum, as the Relative Strength Index (RSI) hovers near the oversold threshold around the 30 level. This positioning typically suggests that the market is primed for a bounce, which may encourage traders to adopt a more bullish stance.
The ongoing consolidation near this RSI level also implies that some degree of buying interest has already entered the market—possibly signaling that bulls are preparing for a rebound once favorable conditions align.
Buy Tamadoge!
There’s no mobile runner out there quite like #TamadogePursuit! 🏃♂️
1️⃣ Sign up – start with 20 free credits for a boost!
2️⃣ Climb up the leaderboards.
3️⃣ Win $TAMA rewards!Play Now! 👇
📱Android: https://t.co/Of8SYALRzL
📱 iOS: https://t.co/IthvqovwAH pic.twitter.com/84HNqob9Rf— TAMADOGE (@Tamadogecoin) September 10, 2024