Polygon (MATIC/USD) Price Downsizes, Finding Support at $0.80
Estimated Reading Time: 3 minutes
Don’t invest unless you’re prepared to lose all the money you invest. This is a high-risk investment and you are unlikely to be protected if something goes wrong. Take 2 minutes to learn more
Polygon Price Prediction – December 18
In the wake of trying to complete a declining force during a convergence=trading outlook on the MATIC/USD market operations, the crypto’s price downsizes, finding support around the $0.80 line recently. In the last hours, the trading pace capacity has not been gaining wide spaces as the market bargaining point is at $0.817 at a minute average percentage rate of 0.12 positive.
MATIC/USD Market
Key Levels
Resistance levels: $0.95, $1.05, $1.15
Support levels: $0.75, $0.70, $0.65
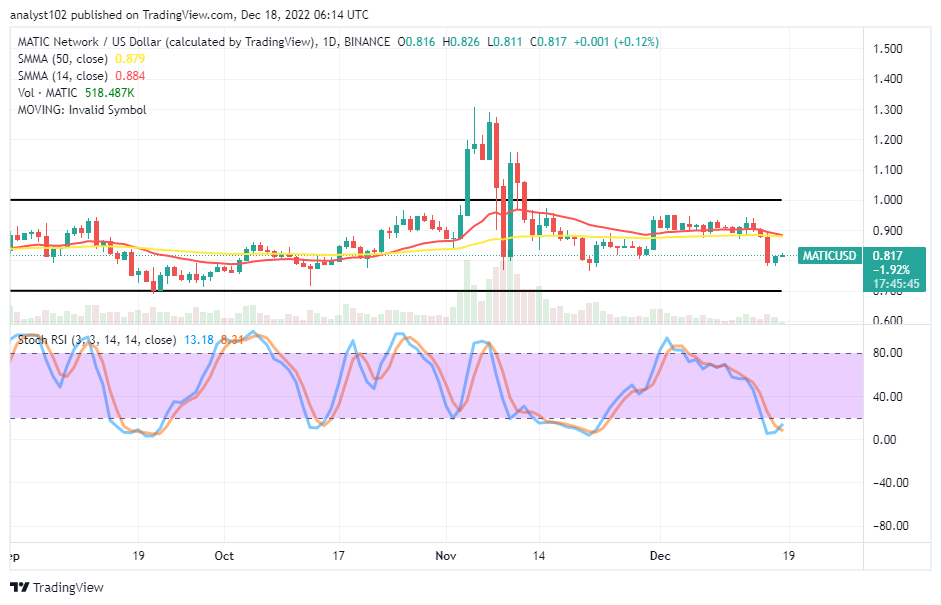
MATIC/USD – Daily Chart
The MATIC/USD daily chart reveals that the crypto market price downsizes, finding support around the $0.80 trading level below the SMA trend lines. The 14-day SMA indicator is at $0.884, a bit over the $0.879 value line of the 50-day SMA indicator. The horizontal lines mark the psychological upper range point of the market at the $1 level and the lower logical value at the $0.70 level, embodying the SMAs. The Stochastic Oscillators have journeyed into the oversold region to cross northbound at 8.31 and 13.18 levels.
Will the MATIC/USD market not consolidate bearish movements near the $0.80 mark?
A sign emanated from the reading of the Stochastic Oscillators have slightly crossed their lines northward to dowse the forces that can back the MATIC/USD market bears to consolidate their stances around the $0.80 point as the crypto’s price downsizes to find support at the value line. Investors who have not yet purchased a portfolio related to the crypto economy have a higher chance of doing so in the interim. Additionally, more positions can add to previous purchases.
The appearance of a smaller bullish candlestick during yesterday’s session extended a force to the upside slightly in a relatively-continuation moving mode against a sign to get a sell order right now. Especially from its current trading capacity level, it might not technically incline to launch a safe shorting position below the SMA trend lines.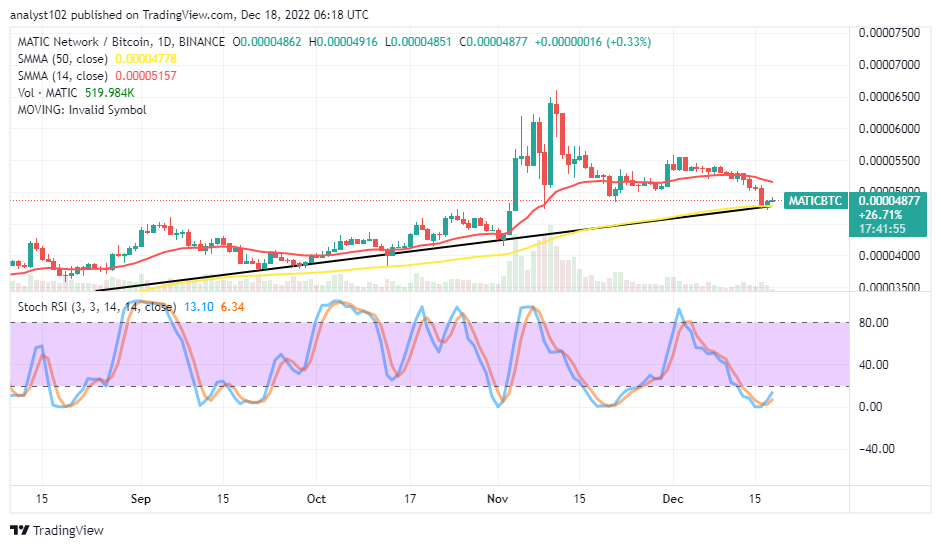
MATIC/BTC Price Analysis
In comparison, Polygon has remained succumbing to a correction and maintains a bullish outlook trend against the trending force of Bitcoin on the daily price analysis chart. The pairing cryptocurrency market price downsizes, finding support around the bigger SMA trend line. The bullish trend line provides a supportive path to the 50-day SMA indicator below the 14-day SMA indicator. The Stochastic Oscillators have dipped into the oversold region. And they are trying to cross their lines northbound at 6.34 and 13.10 levels. That means the counter crypto has somewhat pushed for a retracement, reaching a maximal lower-trading spot against its base crypto.
Note: Cryptosignals.org is not a financial advisor. Do your research before investing your funds in any financial asset or presented product or event. We are not responsible for your investing results.
You can purchase Lucky Block here. Buy LBLOCK